Written by Rajeev Gupta, founder of EliteAlgo. Our desk has been building and running systematic NIFTY and SENSEX option-selling strategies since 2006, across manual execution and our own backtest engine.
Paper trade before any of this touches live capital. Nothing below is investment advice, and nothing below recommends a strike, an expiry or an underlying. EliteAlgo is proprietary trading research and analytical software, not an advisory service. This page explains how to read a screen, not what to do about it.
Quick Answer
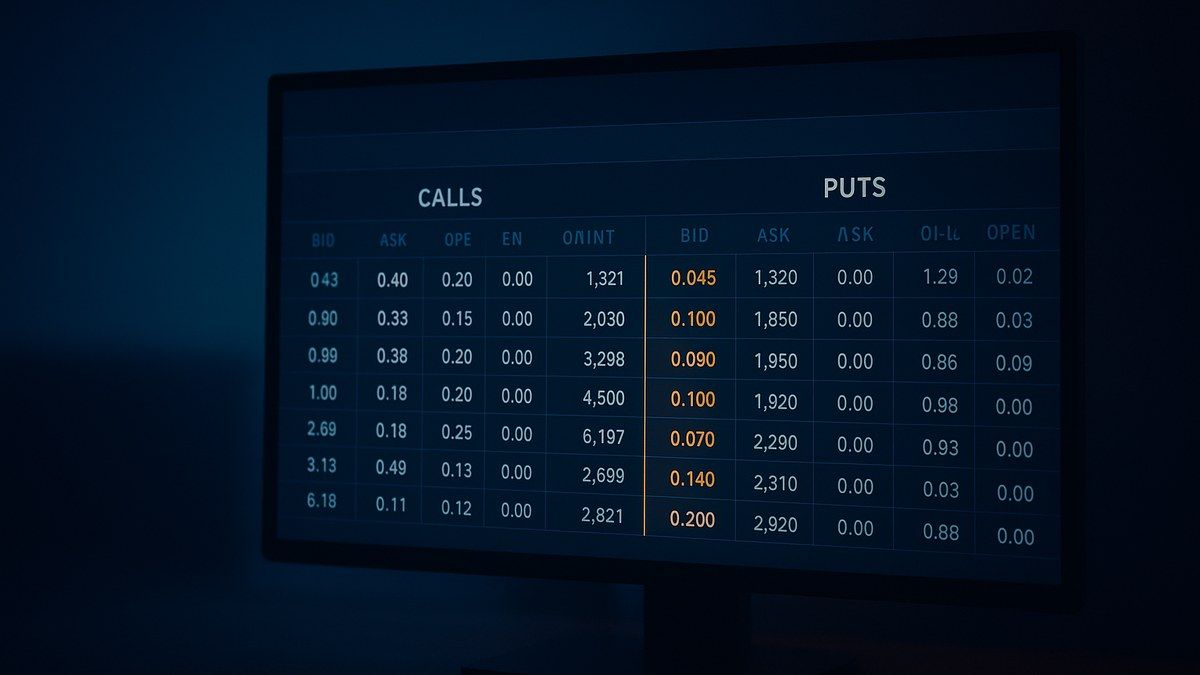
An option chain is a single table listing every option contract available on one underlying for one expiry. The layout is always the same: strike prices run down the middle, calls sit on the left, puts sit on the right, and each side repeats the same set of columns — last traded price, bid, ask, volume, open interest, change in open interest and implied volatility. Every row is one strike. Reading the chain means reading across one row to understand one contract, not scanning down the screen looking for the biggest number. Two columns cause nearly all of the confusion for a new reader: open interest, which is the number of contracts currently outstanding at that strike and is not the same thing as volume, and implied volatility, which is a figure worked backwards out of the option's own market price rather than a measurement of the index.

What the chain actually is
Open the option chain for an index on any trading day and you get a wall of numbers. It looks like a dashboard. It is not. It is a price list with a position ledger attached, and knowing which column belongs to which of those two things is most of the skill.
Every option contract is defined by four things: the underlying, the expiry date, the strike price, and whether it is a call or a put. Fix the underlying and fix the expiry — which is what the dropdowns above the table do — and what remains is a grid: one row per strike, two contracts per row. That grid is the option chain. Nothing is hidden and nothing is interpreted for you; the screen simply shows, for each of those contracts, what it last traded at, what is being bid and asked for it right now, how much of it has changed hands today, how many contracts are outstanding, and what volatility figure the market's price implies.
Two consequences follow, and they are worth holding onto:
- The chain is a snapshot, not a verdict. It tells you what is true at a moment. It contains no opinion about direction and no signal, however many people read one into it.
- Half of it is live quotes and half of it is accumulated history. Bid, ask and last-traded price are live. Volume and open interest are totals built up over time. Mixing the two up is the single most common beginner error on this screen, and it produces conclusions that sound data-driven and are not.
How the screen is laid out
The layout is a convention followed by the exchanges and by essentially every broker terminal, which is why a chain looks familiar once you have read one.
- Down the centre: the strike price column. Strikes are listed in order, in fixed steps set by the exchange for that underlying. These are the prices at which the contracts can be exercised.
- To the left of the strikes: the call side. Every column on the left belongs to the call option at the strike in that row.
- To the right of the strikes: the put side. The same columns repeat, now describing the put at that same strike.
- Above the table: the controls. An underlying selector, an expiry selector, and usually the current spot price of the underlying. Change the expiry and the entire table changes, because you are now looking at a different set of contracts.
- Usually highlighted: the rows nearest the spot price. Most screens shade the strikes closest to where the underlying is currently trading, which is a navigation aid rather than a recommendation.
The mirrored layout is not decoration — it exists because calls and puts at the same strike are opposite sides of the same question, and the design lets you compare them in one glance. It also produces the one visual pattern worth knowing on day one: reading down the call side from the top, premiums get larger as you approach spot and smaller as you move above it; the put side does the same thing in the other direction. That is moneyness showing up as a shape on the screen. Calls below the spot price are in the money and calls above it are out of the money; for puts it is the other way round. If those words are not yet solid, ITM, OTM and ATM is the vocabulary page, and it is the one piece of background this screen genuinely assumes.
Every column, one at a time
The exact set varies slightly between the exchange's own screen and your broker's, but these are the fields you will meet. They appear on both the call and the put side.
Strike price. The centre column. The price at which the option can be exercised. Set by the exchange in fixed intervals, not by the market.
LTP (last traded price). What the contract most recently changed hands at. This is the option's premium — the amount per unit that a buyer pays and a seller receives. It is a historical fact about the last trade, which may have been seconds or hours ago, and this matters: on a thinly traded strike, the LTP can be badly stale while the bid and ask have moved on.
Net change (and % change). How the premium has moved since the previous day's close. Useful context, occasionally alarming, and worth remembering that an option's premium can move several per cent while the underlying barely moves at all.
Bid and ask (also called bid and offer). The best price someone is currently willing to buy at, and the best price someone is currently willing to sell at. These are live and they are the prices you would actually transact at. The LTP sits somewhere between them in a healthy market, and drifts outside them in an unhealthy one.
Bid quantity and ask quantity. How much is available at those two prices. A tight-looking bid-ask gap with tiny quantities behind it is not the same as a tight market.
Bid-ask spread. Not always a separate column, but the number you should compute in your head on every row you care about: ask minus bid. It is the instant cost of entering and leaving. A contract with a premium of 40 and a spread of 6 costs you 15% of the premium just to round-trip, before anything else happens. For anyone writing options rather than reading about them, this one column does more work than any other, and option chain analysis for option sellers treats it as a hard pass-or-fail filter.
Volume. How much of that contract has traded today. It resets every session. High volume means the contract is actively being traded right now, which means you are more likely to get filled at a sensible price.
Open interest (OI). How many contracts at that strike are currently outstanding — opened and not yet closed. This does not reset daily. It is the single most misunderstood column on the chain and it gets its own section below.
Change in OI. How open interest has moved since the previous session's close. This is where people look for positioning, and it is also where most of the folklore lives.
IV (implied volatility). A percentage figure derived from the option's market price, not measured from the index. Its own section below as well.
Theoretical price (sometimes "fair value" or "model price"). What a pricing model says the contract should be worth given its inputs. The gap between this and the LTP is often presented as if it were an opportunity. It is usually a statement about the model's inputs rather than about the market.
The Greeks — delta, gamma, theta, vega. Risk measures for that specific contract. Some chains show them as columns, many do not. Covered below.
Intrinsic value and time value (extrinsic value). Intrinsic value is how much the option is already worth if exercised immediately — zero for every out-of-the-money contract, which is most of the screen. Time value is the rest of the premium: everything you are paying for the possibility of future movement. For any out-of-the-money option the entire premium is time value, and where that number comes from is worked through in how option premium is actually priced, strike by strike.
Day's high and low on the premium. The range the option's own price has traded in today. This is price-swing framing, aimed at someone trading the option as an instrument rather than holding it to expiry.
That is fourteen to sixteen columns per side, depending on the screen — thirty or so numbers per row. The useful discovery for a beginner is that this is not a list of thirty things to learn. It is roughly four things repeated: what it costs (LTP, bid, ask, net change), how easily you can trade it (volume, spread, quantities), how many people are in it (OI and change in OI), and how it is being priced (IV, theoretical price, the Greeks, intrinsic and time value).
What open interest actually is
Open interest is the number of contracts at that strike and expiry that are currently open — created by someone opening a position and not yet closed out. That is the whole definition. It is a count of live contracts, not of trades, not of people, and not of money.
The reason it confuses people is that it is the only column on the chain that can be created and destroyed by a trade. Every option contract comes into existence when a buyer and a seller each open a new position against each other, and ceases to exist when both sides close. So a single transaction can do three different things to open interest depending on what the two parties were already holding:
- Both sides opening new positions → OI rises by one contract. A new contract has been created.
- Both sides closing existing positions → OI falls by one. A contract has been extinguished.
- One side opening, the other closing → OI is unchanged. The contract has simply changed hands.
All three of those cases add to volume, because volume counts trades regardless of what they do to positions. That is the cleanest way to hold the distinction:
| Volume | Open interest | |
|---|---|---|
| Counts | Contracts traded | Contracts outstanding |
| Period | Today only, resets each session | Cumulative, carried forward |
| Can it fall? | No, only accumulates during the day | Yes, when positions are closed |
| Answers | How much activity is there right now? | How much position is already there? |
A worked distinction, because the arithmetic makes it stick. A strike shows volume of 10,000 and open interest of 1,000. Those numbers are not contradictory and nothing is wrong with the data: the contract has been traded heavily today by people passing it back and forth, and very little new position has actually been built. Reverse it — volume of 500 against open interest of 200,000 — and you have a strike where a large position is sitting quietly, placed earlier, barely touched today.
Two practical notes. First, open interest at expiry goes to zero for that contract, because every open contract is either exercised or expires. Second, the units matter: chains report OI in different units depending on the source — some in contracts, some in the underlying quantity. Our own house convention is to report OI in lots, because reading a lots figure as a units figure is a magnitude error large enough to invalidate anything built on top of it. Contract and lot specifications are set by the exchange and revised from time to time, so take the current ones from the exchange rather than from any article.
And now the honest handoff. Everything above is what open interest is. What it means — whether a build at a strike signals support, whether rising OI with a rising price tells you anything, what the four-box "long build-up / short build-up" table is worth, how expiry week distorts the day-over-day change — is a separate and much more contested subject, and most of what circulates about it does not survive contact with data. We have given it its own page: NIFTY OI data without the folklore goes through which readings hold up and which do not. Read the definition here, read the interpretation there, and do not skip to the interpretation.
What the IV column in an option chain is telling you
Implied volatility is the column most likely to be nodded at and misread, because it looks like a measurement and is not one.
An option pricing model takes a set of inputs — the underlying's price, the strike, time left to expiry, interest rates, and an assumption about how volatile the underlying will be — and produces a price. Implied volatility is that calculation run backwards. You take the price the option is actually trading at in the market, and you solve for the volatility figure that would make the model produce it. So the IV in an option chain is not an observation about the index. It is an observation about the option's price, expressed in volatility units.
Three things follow, and they clear up most of the confusion:
- It is per contract, not per index. Every strike on the chain has its own IV, and they are not the same. Two strikes on the same underlying with the same expiry routinely show different IVs, because they are trading at prices that imply different things. The pattern those differences form across the chain is called skew, and reading it is a seller's skill rather than a beginner's — the seller's chain page works through it.
- It is quoted as an annualised percentage. An IV of 14% does not mean the index is expected to move 14% before expiry. It is an annualised figure, which is why converting it into an expected move over the period you actually care about is a necessary step and not an obvious one. For the index-level version of that conversion, India VIX and your short strangle's premium budget does the arithmetic properly.
- High IV does not mean "expensive" and low IV does not mean "cheap". It means the market is pricing a lot, or a little, future movement. Whether that price is right is exactly the open question, and the IV column cannot answer it — it is a restatement of the price, not a judgement on it.
One thing the IV column is genuinely good for on day one: comparison. Looking across neighbouring strikes, or across two expiries, IV lets you compare option prices that are otherwise not comparable, because it strips out the strike and the time remaining. A premium of 40 on one strike and 90 on another tells you nothing about relative pricing. Their IVs do.
Where the Greeks appear on the chain
Some chains show delta, gamma, theta and vega as extra columns per side; many show none of them. In one line each: delta is your directional exposure, gamma is how fast that exposure changes, theta is how much premium erodes per day, and vega is your exposure to IV itself changing.
Two warnings about reading them from the chain specifically, since that is this page's job. First, chain Greek columns are often stale. They are computed values, refreshed on the page's own cycle rather than streaming, and under fast conditions they can be seconds behind — which is precisely when they matter. Your execution terminal's live values are the ones to trade against. Second, a Greek on a single row describes one contract, not your position. If you are holding more than one leg, the number that matters is the combined exposure across all of them, and the chain cannot show you that because it does not know what you hold.
That is the full extent of the Greeks on this page — where they sit and why the chain is the worst place to read them. What each one actually measures, how they behave as expiry approaches, and which of them is the real risk for a seller are all worked through properly in option Greeks explained. That is the page to read next if the Greek columns are what brought you here.
PCR, and the other tiles above the table
Most broker chains put a few summary tiles above the grid. The one that gets asked about most is PCR.
PCR — the put-call ratio — divides a put-side total by the matching call-side total. If the number is above 1 there is more on the put side than the call side; below 1, the reverse. That is the arithmetic, and it is simple. The complication is that the name covers two different calculations: PCR by open interest (outstanding positions) and PCR by volume (today's trading). They can point in opposite directions on the same screen, so a PCR quoted without saying which one it is is an unusable number.
Beyond that, what a given PCR reading means is genuinely disputed — it is read as a contrarian crowding gauge by some and as trend confirmation by others, and those are incompatible interpretations of the same figure. The familiar 0.7-and-1.3 thresholds have a specific origin and specific conditions under which they stop working, particularly on expiry day. That argument is laid out in why the 0.7/1.3 PCR rulebook breaks on expiry day, and it is worth reading before you let a tile influence a decision.
The broader point about all of these tiles: a summary number sitting above the chain is not a substitute for the strike-level columns inside it. A PCR reading tells you something about overall positioning. It cannot tell you whether the specific contract you are about to trade has a spread you can afford to cross.
How to read one row, end to end
This is the habit that turns the screen from a wall into a tool. Pick a row. Read across it. Do not scan the screen.
Round numbers, illustrative, not quoted prices and not a strike suggestion. Say the index is at 24,860 in mid-morning. You are looking at the 24,700 put — below spot, so out of the money. The row shows: LTP 58, bid 56, ask 60, volume 8,400 lots, OI 1.42 lakh lots, change in OI +9,200 lots, IV 13.6%.
Read in order, and say what each number does:
- Where is this strike relative to spot? 24,700 against 24,860 — below, so this put is out of the money. Its entire premium of 58 is time value; it has no intrinsic value at all. That one orientation step prevents most misreadings further down the row.
- What does it cost, and what would it cost to leave? LTP 58, but the real numbers are bid 56 and ask 60. The spread is 4 on a premium of 58 — just under 7% to round-trip. That is the number to carry, not the 58.
- Can I actually trade it? Volume of 8,400 lots says the contract is active today. Thin volume is where a quoted price becomes theoretical.
- How much position is already here? OI of 1.42 lakh lots is a substantial standing position. Note the units — lots, not individual units.
- Is that position new or old? Change in OI of +9,200 lots says fresh contracts were created since the last close, rather than old ones sitting unchanged. What that implies is the interpretation question, and it belongs to the OI page.
- How is it priced relative to its neighbours? IV 13.6% is only meaningful next to the strikes either side of it. On its own it is a number with no scale.
Six questions, one row, and you now know what the contract is, what it costs to get in and out of, whether you can transact it, and how it sits against its neighbours. Then — and only then — compare it with the row above or below. Comparing strikes before you have read either row properly is how people end up choosing on premium alone, which is the most expensive way to pick a contract.
Five things beginners misread on the chain
"The biggest open interest number is a support or resistance level." It is the strike where the most contracts are outstanding. That is a fact about positioning, and turning it into a price prediction requires assumptions the data does not contain. This is the heart of what the OI folklore page takes apart.
"High volume and high open interest are the same signal." They answer different questions — activity today versus position already built — and they frequently disagree. A strike can be busy and empty, or quiet and crowded.
"The LTP is the price I will get." The LTP is the last trade. The bid and the ask are your prices, and on an illiquid strike the gap between them can be a meaningful share of the premium.
"A high IV strike is overpriced, so I should sell it." A high IV means the market is pricing more movement for that contract. It may be right. The IV figure is a restatement of the price you can already see, so it cannot by itself tell you the price is wrong.
"The chain I am looking at is live." Some sources refresh continuously, some are delayed snapshots, and some are both at different times of day. When you are reading rather than trading, that is harmless; when a decision depends on the number, it is not. How much your source matters is covered on the seller's chain page.
Where to go from here
This page's job ends at comprehension — what the screen is, what the columns mean, how to read a row. The decisions start on other pages, and they split cleanly:
- To use the chain to pick a strike as a seller: option chain analysis for option sellers narrows the thirty-odd columns to the six that change a decision and adds the filters that keep a bad fill out of your book. That is the direct next step from here.
- For what open interest means rather than what it is: NIFTY OI data without the folklore.
- For the Greeks properly: option Greeks explained.
- For where the premium number itself comes from: how option premium is actually priced, strike by strike.
- For placing an actual trade from the screen: how to sell options, step by step.
One closing caution, and it is the reason we built our own backtest engine rather than working off dashboards. A chain is easy to misread under time pressure, and the misreading is invisible — the screen looks the same whether you understood it or not. If a decision rests on something you are reading off a chain, the time to check whether that reading holds is before the capital is on it, not after. How to backtest an option-selling strategy is where that checking gets done.
Frequently Asked Questions
What is open interest in options?
Open interest is the number of option contracts at a given strike and expiry that are currently open — created when someone opened a position and not yet closed out. It is a count of live contracts, not of trades, not of participants and not of money. It is the only column on the chain that a trade can create or destroy: if both parties to a trade are opening new positions, open interest rises by one contract; if both are closing, it falls by one; if one is opening while the other closes, the contract simply changes hands and open interest does not move. All three cases add to volume. Open interest is cumulative rather than daily, and it goes to zero at expiry because every open contract is either exercised or expires.
What is an option chain?
An option chain is a single table listing every option contract available on one underlying for one expiry date. Strike prices run down the middle of the screen, call options occupy the columns to the left and put options the columns to the right, with the same set of fields repeated on each side — last traded price, bid, ask, volume, open interest, change in open interest and implied volatility. Each row of the table is one strike, carrying two contracts. The selectors above the table fix the underlying and the expiry, so changing the expiry replaces the entire table with a different set of contracts. The chain contains no interpretation or signal: it reports what is true for each contract at a moment in time.
What is the difference between open interest and volume?
Volume counts contracts traded today and resets at the start of every session, so it only accumulates during the day. Open interest counts contracts currently outstanding, is carried forward from day to day, and can fall as well as rise because closing a position destroys a contract. They answer different questions: volume asks how much activity there is right now, open interest asks how much position is already in place. They frequently disagree, and that is not a data error. A strike showing volume of 10,000 against open interest of 1,000 has been passed back and forth heavily today with little new position built; a strike showing volume of 500 against open interest of 200,000 holds a large position placed earlier and barely touched today.
What does IV mean in an option chain?
IV is implied volatility, and it is an option pricing model run backwards. A model normally takes the underlying's price, the strike, the time to expiry, interest rates and a volatility assumption, and produces a price. Implied volatility takes the price the option is actually trading at and solves for the volatility figure that would make the model produce it. So the IV in a chain is a statement about the option's own market price expressed in volatility units, not a measurement of the underlying. It is specific to each contract, so every strike on the chain has its own IV, and it is quoted as an annualised percentage — an IV of 14% does not mean the index is expected to move 14% before expiry.
Why does IV differ between strikes on the same expiry?
Because IV is derived from each contract's own traded price, and those prices are not set by a single shared volatility assumption. Different strikes carry different demand for different reasons — protection, speculation, hedging an existing position — and the prices that result imply different volatility figures. The pattern those differences form when you read across the chain is known as skew, and it is a normal and persistent feature rather than a pricing error. Interpreting the shape of that pattern is a seller's skill rather than part of learning to read the screen, so a beginner's useful takeaway is narrower: an IV figure means nothing on its own and only becomes informative next to the strikes either side of it.
How do I read option chain data as a beginner?
Read across one row rather than scanning down the screen. For a single strike, ask six questions in order. Where does this strike sit relative to the current spot price, which tells you whether the contract is in or out of the money. What does it cost, reading the bid and the ask rather than the last traded price, and how wide is the gap between them, because that gap is what a round trip costs. Is there enough volume today to transact it. How much open interest is already there, noting the units the source is using. Has that open interest changed since the previous close. And how does the implied volatility compare with the strikes either side. Only after reading a row that way is it useful to compare it with another row.
What is PCR in options?
PCR is the put-call ratio: a put-side total divided by the matching call-side total. Above 1 means there is more on the put side than the call side, below 1 the reverse. The important complication is that one name covers two different calculations — PCR by open interest, which uses outstanding positions, and PCR by volume, which uses today's trading. The two can point in opposite directions on the same screen, so a PCR quoted without specifying which one it is cannot be used. What a given reading means is also genuinely disputed, being read as a contrarian crowding gauge by some and as trend confirmation by others, and the familiar threshold levels have specific conditions under which they stop working.
Where are the Greeks on an option chain?
Some chains add delta, gamma, theta and vega as extra columns on each side; many show none of them at all. Where they do appear, two cautions apply to reading them from the chain specifically. They are computed values refreshed on the page's own cycle rather than streamed live, so under fast market conditions they can be several seconds behind — which is exactly when they matter most, and why a live execution terminal is the better source. And a Greek on a single row describes one contract, not your position: if you hold more than one leg, the figure that matters is the combined exposure across all of them, which the chain cannot show because it does not know what you hold.
Why are calls on the left and puts on the right?
It is a layout convention followed by the exchanges and essentially every broker terminal, which is why any chain looks familiar once you have read one. The mirrored design exists so that the call and the put at the same strike sit on the same row and can be compared in a single glance, since they are opposite sides of the same question. The arrangement also makes moneyness visible as a shape: reading down the call side, premiums grow as you approach the spot price and shrink above it, while the put side does the same thing in the opposite direction. Calls below spot are in the money and calls above it are out of the money; for puts it is reversed.
Is the option chain live or delayed?
It depends entirely on the source, and the screen rarely makes it obvious. Some chains refresh continuously, some serve delayed snapshots, and some behave differently at different times of the trading day. The columns are also not uniform in this respect: bid, ask and last traded price are quote-driven and move constantly, while volume and open interest are accumulated totals that some sources update on a slower cycle. When you are reading the chain to understand it, a delay is harmless. When a decision or an order depends on a number, confirm it against your own execution terminal rather than a web page.
Does the biggest open interest strike act as support or resistance?
The strike with the highest open interest is the strike where the most contracts are currently outstanding. That is a fact about positioning, and converting it into a statement about where price will stop requires assumptions the data itself does not contain — chiefly about who holds those contracts, on which side, and whether they will defend the level. It is one of the most repeated readings of the chain and one of the least reliable. Open interest supports two readings that hold up much better, both about liquidity and crowding rather than about price levels, and those are worth learning in place of the support-and-resistance habit.
Why is the premium the same strike shows different for calls and puts?
At one strike, the call and the put are pricing opposite outcomes, so their premiums reflect different things. If the strike sits below the current spot price, the call is in the money and carries intrinsic value on top of its time value, while the put at that same strike is out of the money and is entirely time value — above spot, that reverses. Beyond the intrinsic component, the two sides can also carry different implied volatilities because demand for downside protection and for upside exposure is rarely equal, so the market prices them differently even at equal distance from spot.
The Bottom Line
An option chain is one table listing every contract on one underlying for one expiry: strikes down the middle, calls on the left, puts on the right, the same columns repeated on both sides. Half the columns are live quotes — last traded price, bid, ask — and half are accumulated totals, chiefly volume and open interest, and keeping those two groups separate prevents most beginner errors. Open interest is the number of contracts currently outstanding at that strike, which a single trade can increase, decrease or leave unchanged depending on what the two parties were holding; volume counts every trade regardless and resets each session. Implied volatility is not a measurement of the index but the option's own market price restated in volatility units, quoted annualised, and different at every strike. The Greeks, where a chain shows them at all, describe one contract and are often stale. Read across a single row before you compare rows — where the strike sits relative to spot, what it costs to enter and exit, whether it can be traded, how much position is already there — and the wall of numbers becomes four questions asked thirty times.
This article is for educational and informational purposes only and does not constitute investment advice. EliteAlgo is proprietary trading research and analytical software; it is not a SEBI-registered investment adviser and does not provide investment advice, strike or strategy recommendations, or trading tips. No strike, expiry, structure or underlying mentioned or implied above is recommended, and the worked example uses illustrative round numbers rather than quoted prices. Options trading involves substantial risk of loss and is not suitable for all investors. Contract specifications, lot sizes, strike intervals, margin requirements, settlement procedures, tax rates and charges are set by the exchanges, SEBI, the government and your broker and are revised from time to time — verify all current figures from the exchange or the notification in force before trading. Data shown on an option chain may be delayed or snapshot-based depending on the source; confirm live values from your own execution terminal. Paper trade before deploying live capital and consult a SEBI-registered investment advisor before trading derivatives.