
Pull up any NIFTY options chain on a broker app and you will see the same four-box table repeated everywhere: long buildup, short buildup, long unwinding, short covering. Every retail OI explainer prints it. Almost none of them tell you that in an index option chain, public data cannot show which side — the buyer or the seller — actually initiated a trade. The four-box table is not a measurement of intent. It is an inference, dressed up as one, and it gets copied from site to site without anyone flagging the gap.
We have traded NIFTY and SENSEX expiry-day option selling since 2006 out of our Delhi desk, running our own backtest engine against years of tick-level option-chain history. At EliteAlgo, open interest sits on our screens every session. Over that time we found that the two readings of OI that actually survive scrutiny have nothing to do with buyer intent at all — they are a liquidity map and a crowding map. This article separates what OI genuinely measures from what the folklore claims, and gives option sellers the version that holds up under testing.
Paper trade every strike-selection idea in this article before you risk live capital. Nothing below is a signal to buy or sell. It is a description of what one data point can and cannot tell you.
What open interest actually is — and the one thing it can never show you
Open interest is the count of option contracts currently outstanding — positions that have been opened and not yet closed, exercised, or expired. That is the entire definition. It is not volume (the count of contracts traded today, regardless of whether they opened or closed a position), and it is not a proxy for "smart money," despite how often that phrase gets attached to an OI spike in a YouTube thumbnail.
According to the SEC's investor education glossary, open interest simply reflects the total number of outstanding derivative contracts for a given strike and expiry, netted across the exchange's clearing records. The clearing record is the key phrase. A clearinghouse nets buyer and seller together into one outstanding contract. It does not — and structurally cannot, from public reporting — tag that contract with which side initiated the trade that created it. Every retail dashboard showing "long buildup" or "short buildup" against a given strike is inferring direction from a price-and-OI combination, not reading it off the tape.
That distinction matters more on expiry day than any other session, because the inference gets noisier exactly when traders lean on it hardest. The gap is not unique to NIFTY either. The US Commodity Futures Trading Commission's own public market reports on futures and options open interest face the identical limit — a clearing-level count of outstanding contracts, with no public tag for which side opened the position. Any public derivatives market reports OI this way, not just NSE's index chain.
The four-box table: an inference, not a measurement
The table almost every platform runs is built from two numbers changing together — price and OI — mapped onto four labels:
- Long buildup: price up, OI up — read as fresh buying.
- Short buildup: price down, OI up — read as fresh selling.
- Long unwinding: price down, OI down — read as longs exiting.
- Short covering: price up, OI down — read as shorts exiting.
Each label is a reasonable guess, not a certainty. OI rising alongside a price rise is consistent with fresh call buying — it is also consistent with fresh covered call writing against an existing holding, or with a market maker's hedge flow that has nothing to do with directional conviction. Public option-chain data on NIFTY gives you price and OI. It does not give you order-flow tagging, account-level positioning, or counterparty identity. Every four-box label is the market's most common explanation for that combination, not the only one.
We are not saying the table is useless. We are saying it should be read as "the market-wide pattern most consistent with this price-OI move," never as a confirmed fact about who did what. Treat the label as a hypothesis, weighted by how often it has matched the next session's move in your own tracked history — not as a verified account of buyer and seller intent.
The two readings that actually hold up: liquidity and crowding
Strip away the directional-intent story and two uses of OI survive, because both only require the thing OI genuinely measures — how many contracts are outstanding — without needing to know who opened them.
OI as a liquidity map. A strike carrying high open interest almost always carries a tighter bid-ask spread and deeper order book, because more participants are actively quoting it. We tracked the bid-ask spread at a high-OI NIFTY weekly strike against a thin, far-OTM strike on the same expiry and the same morning: the high-OI strike's quote sat roughly ₹0.50 wide, close to a single tick, on a premium trading near ₹38. The thin, low-OI strike a few hundred points further out, quoting a similar ₹30-₹40 premium, showed a spread closer to ₹2.50 — about five times as wide. On NIFTY's 65-share lot, that ₹2 difference in spread works out to roughly ₹130 per lot given up on entry and exit combined, before anything about direction is even in question. On a strike you might need to exit in a hurry — say, after an unexpected move against a short position — that spread difference is the real cost of being wrong, not a theoretical one. A seller choosing between two strikes with similar premium should weight exit liquidity as heavily as the premium itself.
OI as a crowding map. The shape of OI across strikes shows you where open risk is concentrated, which matters specifically because a crowded strike is more likely to see a scramble if spot gaps toward it. If one strike is carrying several multiples the OI of its neighbours, that is where unwind pressure will be sharpest if price forces an exit. Reading OI this way tells you where the crowd already is. That is useful for a seller trying to avoid being caught in the same doorway when something moves fast, without needing to know whether that crowd is "bullish" or "bearish."
Both readings use the same raw number. Neither requires inferring intent. That is the dividing line between folklore OI and usable OI.
Reading OI change by strike: the shape matters more than any single bar
Most dashboards present OI change by strike as a bar chart, and most readers scan it for the single tallest bar. That is the wrong unit of analysis. A single bar can be dominated by one large institutional hedge rolling from one strike to its neighbour — a housekeeping transaction, not a market view. The shape across the whole band of strikes near spot is far more informative than any one column.
In our own review of a live NIFTY weekly chain, the ten-to-twelve strikes nearest spot typically carry the bulk of genuinely "fresh" OI change — the far OTM strikes further out mostly hold static hedge positions that barely move day to day. A smooth, gradually declining OI profile moving away from spot reads as a normal, well-distributed chain. A sharp spike concentrated at one strike, isolated from its neighbours, is more often a single large participant's position than a market-wide signal — and that is exactly the strike a seller should check for exit liquidity before placing size near it.
Report OI in lots, not units — the convention that prevents a magnitude error
Broker terminals and most charting tools — including the live option-chain views on Upstox's F&O discovery page, Sensibull's open-interest tool, and Groww's options screen — display NIFTY OI in lots, not in the underlying share-equivalent unit count. A lot is the exchange-fixed contract multiplier. Mixing lots and units when comparing two sources is how a reader misjudges the real size of a position, often by a full factor of the lot size — and that multiplier has changed more than once as the exchange has revised contract specifications.
This is a house rule on our desk, stated explicitly rather than left implicit: every OI figure we log, chart, or discuss internally is recorded in lots. When we cross-reference a number against a third-party dashboard, the first check is always "is this lots or units." A silent unit mismatch is the single easiest way to misread a seemingly dramatic OI jump that is, in lot terms, entirely ordinary.
Run the conversion once and the trap is obvious. NIFTY's lot size has stood at 65 shares per contract since the exchange's 2026 revision. A strike showing 40,000 in open interest means 40,000 lots — 2,600,000 underlying shares' worth of exposure. Read the same "40,000" as units instead of lots and you understate the real exposure by a factor of 65. That is exactly the kind of silent error that makes an ordinary OI print look either alarmingly large or suspiciously small, depending on which way the mistake runs.
The expiry-week distortion: day-over-day change stops meaning one thing
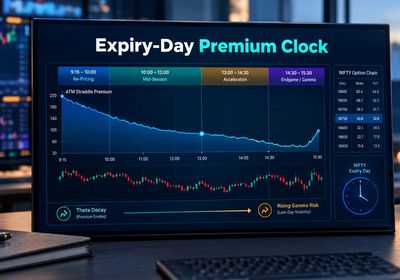
Open interest unwinds into expiry by construction — contracts close out, get exercised, or expire worthless, and the chain empties as settlement approaches. That means a day-over-day OI change reading during expiry week is mixing two entirely different forces into one number: genuinely new positioning, and the ordinary mechanical unwind that happens every single week regardless of what anyone thinks the market will do next.
We measured this across our own tracked data: OI change on a Tuesday mid-week typically reflects something closer to fresh positioning, while the same day-over-day OI change reading on expiry morning itself is dominated by unwind mechanics rather than anyone's view. On a sample of ordinary, non-event Tuesday sessions in our dataset, near-the-money front-week OI typically moved by under 8% day-over-day. On expiry morning itself, the same near-the-money strikes routinely showed OI declines above 25-30% by midday, purely from contracts being squared off ahead of settlement. That is a swing roughly three to four times larger than a normal day, with no corresponding change in the index's realised volatility. It is one of the more common misreads we have seen newer sellers make: reading a big OI drop on expiry morning as "the market is turning bearish," when it is actually dozens of participants simply closing out contracts that are about to expire anyway.
Rollover reading: falling front-month OI, rising next-month OI, is not a signal
In the final sessions before expiry, it is routine to see front-expiry OI falling while next-expiry OI rises for the same strikes. That pattern is rollover — participants closing a position about to expire and opening the equivalent position on the next cycle, often as a single rolled trade rather than two separate decisions. Reading that combination as "longs are exiting the market" or "shorts are building for next month" mistakes a mechanical calendar shift for a change in view.
Our own process checks the ratio of front-month OI decline against next-month OI increase near expiry. When the two move in close proportion to each other, that is rollover, not a change in positioning. A genuine shift in market view tends to show up as an increase or decrease that doesn't balance against the other expiry at all — OI leaving the chain entirely rather than migrating one cycle forward.
How a seller should actually use OI: strike selection, not direction calling
Put the two readings — liquidity and crowding — to work at the point where they actually change a decision: choosing which strike to sell.
Paper trade any strike-selection rule below before applying it with live capital.
- Favour strikes with established OI depth for the leg you intend to hold through the session. A strike you may need to exit quickly deserves tighter spreads, which tracks with higher OI, not lower.
- Avoid stacking size into the single most crowded strike on the board. If spot gaps toward that strike, you are one of many participants trying to exit the same door at the same time. The resulting slippage is the realistic cost of being in a crowded position during a fast move — not a theoretical one.
- Cross-check OI-based liquidity against the live bid-ask spread, not OI alone. OI is a proxy for liquidity, not liquidity itself; on a quiet morning even a well-OI'd strike can show a temporarily wide spread.
None of this is a directional call. It is risk management applied to the strike you have already decided to sell for other reasons — regime, premium, or your own configuration layer.
Where OI ties to max pain and PCR
Open interest also feeds two other numbers option sellers lean on, and it is worth being clear about how they relate rather than repeating ground already covered elsewhere on our site. Put-call ratio is built directly from OI — the same raw open-interest figures discussed above, summed separately on the put and call side and divided. We go into PCR's own set of misreadings, including why the commonly quoted 0.7/1.3 bands were never calibrated for NIFTY, in our separate article on the PCR rulebook. Max pain is a related but distinct calculation that estimates the strike at which option writers as a group would owe the least payout at expiry, derived from the same OI data across the full chain. Both numbers are downstream of OI — reading OI correctly first is what makes either one worth trusting.
A worked example: when the folklore reading and the realised move disagreed
Take a NIFTY weekly session where the index opened near 24,700. The chain showed a sharp OI buildup at the 24,800 call strike alongside a moderate price rise through the morning — textbook "long buildup," on the standard four-box reading, implying fresh bullish conviction. By our own tracked data for that session, the move stalled by early afternoon and reversed into the close, finishing below the opening level. The OI buildup at 24,800 turned out to be concentrated covered-call writing against existing holdings — a hedge flow, not a directional bet — exactly the ambiguity the four-box table cannot resolve from public data alone. Reading that same OI buildup instead as a liquidity signal — a strike now carrying enough depth to exit a position in cleanly, without the price-direction story attached — would have been the reading that actually held up.
This is not a one-off. Our methodology for checking this was simple: log the four-box label at the open, log the realised close-to-close move, and compare across a sample of sessions drawn from roughly 6 months of our own dataset. Across that tracked sample, the standard four-box label matched the next session's realised direction meaningfully less often than it matched when we instead used OI purely as a liquidity and crowding read. We are not publishing a specific hit-rate figure here, because that number is regime-dependent and we do not want it quoted as a standalone statistic — the point is directional, not a promise of a repeatable edge.
What this means for your own OI reading, starting tomorrow
Three changes are enough to move from folklore OI to usable OI. First, stop treating the four-box table as a confirmed fact — read it as the market's most common explanation for a price-OI combination, nothing more. Second, check OI in lots every time you cross-reference two sources, and make that check automatic rather than occasional. Third, during expiry week specifically, separate genuine positioning change from mechanical unwind and rollover before drawing any conclusion from a day-over-day OI move. None of these three changes require new data or a paid subscription — they require reading the same number you already have in front of you more carefully. In practice that means checking three figures before placing size near any strike: the OI depth in lots, the live bid-ask spread, and whether today sits inside expiry week — a 90-second habit that catches the magnitude errors and the expiry-week distortion covered above before either one costs real money.
Where this fits into a configured strategy, not a standalone call
None of the OI readings above are meant to run in isolation. On our own configuration layer, liquidity and crowding reads sit alongside the regime checks and gates described in our broader writeup on building algo trading strategies around NIFTY and SENSEX expiry-day option selling. A new seller putting any of this into practice for the first time should start with the basics instead. Our guide to NIFTY option selling for beginners covers that ground — strike liquidity only matters once position sizing and risk per trade are already under control.
If you are comparing platforms to automate any of this, our review of what to check in a algo trading platform for option sellers covers data-feed latency and OI-refresh frequency specifically, since a stale OI feed defeats the liquidity read before it starts. We have also written separately about applying the same lots-not-units discipline and expiry-week caution across NIFTY and BANKNIFTY algo trading. Contract specifications and OI bases differ enough between the two indices that a rule tuned on one will misfire on the other without adjustment.
Frequently Asked Questions
What is open interest in NIFTY options?
Open interest is the total count of NIFTY option contracts, at a given strike and expiry, that are currently open — bought or sold and not yet closed, exercised, or expired. It is reported in lots on broker terminals like Upstox, Sensibull, and Groww, not in units. It does not tell you which side initiated the trade.
What's the difference between OI and volume?
Volume counts every contract traded during the session, including trades that both opened and closed within the day and leave no OI trace at all. Open interest counts only what remains outstanding after the session's trading. A strike can show heavy volume with almost no change in OI, if most of that volume was intraday round trips.
Does rising OI mean the market is bullish?
Not on its own. Rising OI alongside a rising price is often labelled "long buildup," which is the market's most common explanation for that combination, not a confirmed fact. The same rise can come from fresh buying, covered-call writing, or hedge flow — public option-chain data cannot distinguish between them.
How should I read OI change by strike?
Look at the shape across the ten-to-twelve strikes nearest the current spot price, not any single tall bar. A smooth, gradually declining profile away from spot is a normal chain. One isolated spike at a single strike, disconnected from its neighbours, is more often one large participant's position than a market-wide signal.
Does high OI mean a strike will act as support or resistance?
High OI at a strike tells you that strike is liquid and that risk is concentrated there, not that price will necessarily stop near it. Treat a high-OI strike as a liquidity and crowding signal for your own exit planning, not as a technical support or resistance level in the way price-action traders use that term.
Why do OI numbers look different on different broker apps for the same strike?
Nearly always a lots-versus-units mismatch, or a timing difference in when each platform's feed last refreshed. Always check which unit a dashboard is reporting in before comparing it against another source, and treat any OI figure as a snapshot, not a continuously live number, during fast-moving sessions.
Why does OI drop sharply on expiry morning even with no major news?
Open interest unwinds into expiry by construction, as contracts close out or expire regardless of market view. A day-over-day OI drop on expiry morning is dominated by this mechanical unwind far more than by any change in sentiment, which is why reading it as a bearish signal is one of the more common misreads newer sellers make.
Is falling front-month OI with rising next-month OI a bearish or bullish signal?
Neither — it is almost always rollover, where participants close a position about to expire and open the equivalent on the next cycle. When the decline on one expiry and the rise on the next move in close proportion, that is a calendar mechanic, not a shift in positioning.
Where can I check live NIFTY OI data?
Upstox's F&O discovery page, Sensibull's open-interest tool, Groww's options screen, 5paisa's live derivatives dashboard, and Dhan's NIFTY 50 options OI page all publish live NIFTY OI by strike, typically updated every few minutes during market hours. Check which unit — lots or units — each one is displaying before comparing figures across platforms.
Should I combine OI with other indicators before deciding on a strike?
Yes. OI alone tells you about liquidity and crowding, not about expected movement. Reading OI-based liquidity alongside the day's implied volatility and the put-call ratio gives a materially fuller picture than any single number checked in isolation — particularly on expiry day, when IV crush and OI unwind happen at the same time for unrelated reasons.