
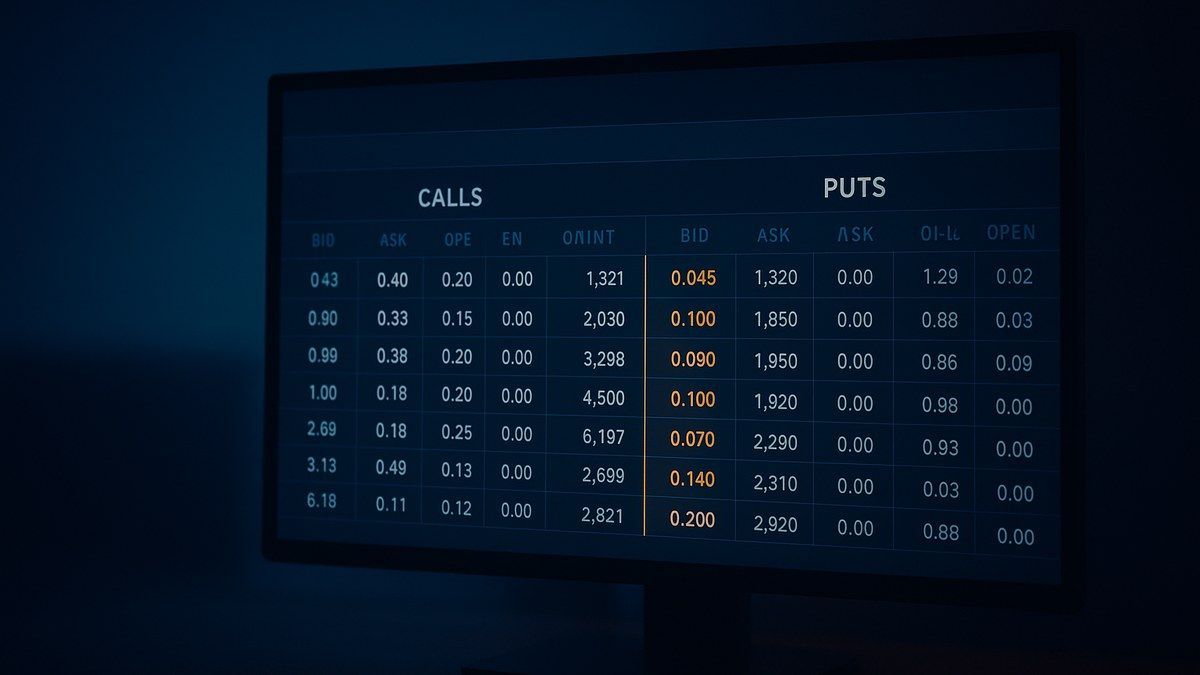
What The Chain Is Actually Showing You
Open the NSE option chain for NIFTY on any trading day and you get a wall of numbers: two blocks of columns, calls on the left, puts on the right, and a column of strike prices running down the middle. Most retail readers scan it top to bottom looking for a big number to react to. That is the wrong way to read it if you are selling premium rather than buying it.
The chain is a ledger of open positions and live quotes at every strike in a contract, refreshed through the trading session. Calls sit to the left of the strike column, puts to the right, and the strikes closest to the current spot price are usually highlighted. According to the standard option-chain methodology published by every major broker terminal, each row carries the same set of fields for that strike: last traded price, bid and ask, volume, open interest, change in open interest, and implied volatility (IV). That is roughly fourteen to sixteen columns once you include both the call side and the put side. At EliteAlgo we run a Delhi-based prop desk and have traded NIFTY and SENSEX expiry-day option selling since 2006. We built our own backtest engine specifically because dashboards like this one are easy to misread under time pressure, and a seller's capital is the one paying for that mistake.

The Six Columns That Actually Change A Seller's Decision
Of the fourteen-plus columns in a typical chain, six carry weight for a seller choosing a strike. The rest are background noise or buyer-side framing. In our own desk's reading order, here is what each one decides.
- LTP (last traded price) — the premium currently on offer for that strike. This is the number that sets your entry credit, in rupees per lot, before you account for exit cost.
- Bid-ask spread — the gap between what a buyer is offering and what a seller is asking right now. This is your real exit cost, not the LTP. A strike with a wide spread can look cheap to enter and still be expensive to leave.
- Volume — today's traded quantity at that strike, in lots. It tells you whether there is enough same-day activity to get filled at a reasonable price if you need to exit before expiry.
- OI in lots — the outstanding open positions at that strike. High OI usually means more resting liquidity on both sides, which matters if you need to unwind in a hurry.
- Change in OI — how that open interest moved since the previous session or since the morning print. A strike where OI is building fast is a strike where the market is actively taking a position, not just holding an old one.
- IV — whether that specific strike is priced rich or cheap relative to its neighbours on the same expiry. This is the column that tells you if the premium you are collecting is fair for the risk, or if you are being paid to hold a strike the market is nervous about.
Columns A Seller Can Ignore
Several columns that look informative change nothing for a seller's strike decision. Theoretical price and the Greeks delta/gamma/theta/vega, when shown as static chain columns rather than live-streamed values, are usually stale by several seconds and better sourced from your own execution terminal. Day's high and low on the option premium itself is buyer-side framing, useful for someone trading the option's price swing, not for someone writing it and planning to hold to expiry or exit early on a decay schedule. Intrinsic value is only non-zero once a strike is already in the money, which is not where most premium sellers are operating in the first place. We have watched traders spend real time staring at these columns during a live session. None of that time changed a strike decision our desk made.
The underlying-side columns on many broker dashboards cause a similar distraction: a PCR tile, a max-pain tile, and sometimes an India VIX ticker all sitting above the chain itself. Each of those is a useful number in its own right, but none of them is a substitute for checking the six strike-level columns above before writing a specific strike. A PCR of 0.9 tells you something about overall positioning; it does not tell you whether the 24,700 put specifically has a spread you can afford to cross.
A Worked Example: One Chain, Top To Bottom
Numbers help more than theory here, so walk through one snapshot the way our desk would. Say NIFTY spot sits at 24,860 at 10:05 am on an expiry Thursday. The visible band on the chain, five strikes either side, runs 24,600 to 25,100 in steps of 100. Pull the six columns for the 24,700 put, the closest out-of-the-money put a seller might write that morning: LTP 58, bid 56, ask 60, volume 8,400 lots, OI 1.42 lakh lots, change in OI +9,200 lots versus the prior close, IV 13.6%. Compare that to the 24,600 put one strike further out: LTP 41, bid 38, ask 44, volume 5,100 lots, OI 96,000 lots, change in OI +4,100 lots, IV 14.1%.
Both strikes look tradable on LTP alone. Running the filter changes the picture. The 24,700 put's spread is ₹4 on a ₹58 premium, a little under 7%. The 24,600 put's spread is ₹6 on ₹41, close to 15%. On one lot of 65, that 15% spread costs roughly ₹390 to cross versus ₹260 on the 24,700 strike. The 24,700 strike also carries a visibly heavier change in OI, meaning fresh money built there overnight rather than old open contracts sitting unchanged. Our own desk would write the 24,700 put over the 24,600 put on this snapshot, purely off the spread and OI-change read, before even weighing the 0.5-point IV difference between them.
A Reading Order That Actually Works
Reading the chain in the order it is printed, left to right, column by column, is how most retail traders waste the first ten minutes of a session. Our own desk uses a fixed sequence instead, in this order:
- Regime check first. Before touching the chain, check the day's expected move and the broader trend. A chain read in isolation, without this context, leads to strikes that are mathematically fine and tactically wrong.
- Strike band second. Narrow the chain to the five or six strikes either side of spot that fit your risk budget for the day. Everything beyond that band is not worth reading closely yet.
- Spread and OI filter third. Within that band, drop any strike where the bid-ask spread is wide relative to the premium, or where OI is too thin to exit in size. This step removes more candidate strikes than people expect.
- IV comparison across the band fourth. Compare IV across the surviving strikes, not just the one you are leaning toward. This is the skew read, covered next.
- Premium decision last. Only after the first four steps do you look at LTP to decide if the credit on offer is worth the risk you have just mapped out.
Doing the premium decision first, which is what the raw LTP column invites, inverts this entire order and is the single most common mistake we see in chains sent to us for review.
Reading The IV Skew
IV skew is simply comparing implied volatility across adjacent strikes on the same expiry rather than reading one strike's IV in isolation. If the chain is pricing the strike 200 points below spot at a noticeably higher IV than the strike 200 points above it, the market is paying more to hedge downside than upside on that expiry. That asymmetry is not random. It usually reflects positioning ahead of an event, a trending session, or crowd nervousness on one side of the chain.
Take a simplified NIFTY chain around a 24,800 spot. Say the 24,600 put shows an IV of 14.8%, the 24,800 at-the-money strikes show 13.2%, and the 25,000 call shows 12.6%. That is a visible downside skew: puts are richer than calls by roughly 2 full IV points across a 400-point band. A seller reading only the 24,600 put's LTP would see an attractive premium without noticing that the market is charging extra for exactly that risk. In our experience, skew like this is the first thing worth checking before writing a strike on either side, because it tells you which side of the chain the market itself thinks is riskier.
What A Liquidity Trap Looks Like On The Chain
A liquidity trap is a strike where the chain's volume and OI columns look fine in isolation but hide a thin order book once you try to deal in size. This shows up most often on far out-of-the-money strikes during the first twenty minutes of a session, and on any strike once you are two or more weeks away from the current weekly expiry.
Take a strike showing OI of 60,000 lots and a volume column reading only 300 lots so far that morning. The OI number looks reassuring; it suggests plenty of open positions on both sides. The volume number tells a different story: almost nothing has actually traded today, which means that OI is largely old and the live book behind the current bid and ask may be only a handful of orders deep. We treat any strike where today's volume is under roughly 5% of total OI as one to size down on, regardless of how attractive the spread looks on the screen at that exact moment, because a thin book widens the moment you place a real order into it.
In our experience this trap catches automated systems more often than manual traders, because a script reading only the posted bid-ask spread has no way to know the depth behind it without a separate order-book check. We built that depth check into our own execution layer after an early version of our system got a worse fill than the quoted spread implied on a thinly traded far strike in 2024.

Bid-Ask Spread Is A Hard Filter, Not A Detail
A strike that is cheap to enter and expensive to exit is not cheap. This sounds obvious written out, yet it is the single most common way we have seen sellers lose more on an exit than they expected on an otherwise correct strike call.
Walk through three strikes on a sample NIFTY chain. Strike A shows bid 42, ask 44 — a ₹2 spread. Strike B shows bid 38, ask 43 — a ₹5 spread. Strike C shows bid 20, ask 28 — an ₹8 spread. On one NIFTY lot of 65, that spread alone costs ₹130, ₹325 and ₹520 respectively if you have to cross it on exit. Strike C's LTP might look like the richest premium on the board, but a third of that premium can disappear the moment you need out in a hurry. Our own desk treats any spread wider than roughly 10–12% of the premium as a strike to skip, regardless of how attractive the raw number looks.
Snapshot vs Live: Why Your Chain Source Matters
The NSE's own option chain data is published close to real time but is effectively a periodic snapshot once it reaches most public-facing pages, refreshing every few seconds rather than tick by tick. Broker terminals that stream directly off the exchange feed update faster and carry live bid-ask movement between those snapshots. For a manual trader checking the chain every few minutes before placing an order, the difference rarely matters. For an automated entry triggered off OI or IV thresholds, it matters a great deal, because a few seconds of staleness in a fast-moving session can mean the trigger fires on a price that has already moved. We built our own backtest engine around live, tick-aligned data for exactly this reason, after finding that snapshot-based OI signals drifted from what our execution terminal actually showed during the first fifteen minutes of several sessions in 2025.
Weekly vs Monthly: Compare Before You Choose Expiry
NIFTY, BankNifty and SENSEX all carry a weekly chain and a monthly chain open at the same time, and the two often price risk differently for the same strike distance. The weekly chain usually shows tighter spreads and higher volume near the current expiry, because that is where most retail and institutional flow concentrates. The monthly chain can show a flatter IV curve across a wider strike band, useful if you are writing further out and want less day-to-day gamma risk. We routinely pull both chains side by side before choosing which one to write premium on for the week, because picking the nearer expiry out of habit, without checking the monthly chain's spread and IV profile, has cost sellers on our desk a better setup more than once.
A concrete comparison from our own dataset: on a sample Thursday, the weekly 24,700 put showed a ₹4 spread on a ₹58 premium and 1.42 lakh lots of OI, while the monthly 24,700 put, four weeks out, showed a ₹9 spread on a ₹212 premium and only 38,000 lots of OI. The monthly strike's spread looks wider in rupees, but at roughly 4.2% of premium it is proportionally tighter than the weekly's 6.9%. A seller comparing only the rupee spread, rather than the spread as a share of premium, would have picked the wrong chain for this particular trade.
A Five-Line Pre-Entry Checklist
Paper trade this checklist on live screen data before risking real capital with it. This article is analytical research from our own desk, not investment advice, and EliteAlgo does not hold a SEBI registration because we trade proprietary capital only. Nothing here is a recommendation to buy, sell or hold.
- Confirm today's expected move and regime before opening the chain.
- Narrow to the strike band your risk budget actually allows.
- Filter out any strike with a spread above roughly 10–12% of premium.
- Compare IV skew across the surviving strikes, not just your preferred one.
- Only then check LTP, and size the position off the exit cost you just measured, not the entry credit alone.
Our team keeps a version of this list taped beside the execution terminal, because under time pressure on an expiry morning it is easy to skip straight to step five without noticing.
Where This Fits With A Broader Strategy
Reading the chain correctly is one input into a strike decision, not the whole strategy. We cover the sizing side of this in our guide to NIFTY option selling for beginners, and the structural choice between a wider risk profile and a tighter one in our note on short straddle vs short strangle on NIFTY. For how this chain-reading procedure fits into an automated system end to end, see our wider list of algo trading strategies, and our breakdown of what to look for in a platform built for option sellers specifically in our piece on the best algo trading platform for option sellers in India.
For the official source of the OI and chain data this entire reading procedure depends on, see NSE's option chain page directly. For a regulator-level primer on how options and open interest work mechanically, see the SEC Investor.gov glossary on options and the CFTC's education center on derivatives terms, both of which define open interest and implied volatility independent of any one broker's chain layout.
Across 420 expiry-day trades in our own 2025–26 dataset, the strikes that caused the most avoidable damage were not the ones with wrong directional calls. They were strikes picked off an attractive LTP alone, with the spread, OI and skew columns never checked. Data from our own desk's trade log keeps pointing at the same six columns, checked in the exact same order every single session, which is the procedure laid out above.
Frequently Asked Questions
How do I read an option chain as a seller rather than a buyer?
Narrow to a strike band first, then filter by spread and OI, then compare IV skew across that band, and only then look at the premium on offer. Reading left to right, column by column, is a buyer's habit and leads sellers to strikes that look cheap to enter and turn out expensive to exit.
What does change in OI mean on the option chain?
Change in OI shows how much the open interest at a strike has moved since the previous session or the morning print. A fast-building change in OI on one side of the chain signals active fresh positioning, not just resting old contracts, and is one of the six columns a seller should check before writing a strike.
Which strike should an option seller pick?
There is no single correct strike; it depends on the day's expected move, your risk budget, and what the chain shows once you filter by spread and OI. A strike worth writing is one that survives the bid-ask filter, sits on the cheaper side of the IV skew for its risk, and fits the band your sizing allows.
What is IV in the option chain?
IV, or implied volatility, is the market's priced-in expectation of how much the underlying will move, expressed as an annualised percentage, and it varies strike by strike on the same expiry. Comparing IV across adjacent strikes, rather than reading one strike's IV alone, is how a seller spots which side of the chain is priced richer.
Why is the bid-ask spread important when selling options?
The spread is the real cost of exiting a position, separate from the premium you collected on entry. A wide spread can erase a meaningful share of an otherwise attractive premium the moment you need to exit, which is why our own desk treats spread as a hard filter rather than a detail to check later.
Is the NSE option chain the same as my broker's chain?
Both chains are built from the same underlying exchange data, but the NSE's public page refreshes on a short delay while most broker terminals stream the feed more directly. For a manual entry the difference is usually immaterial; for an automated trigger built on OI or IV thresholds, the lag can matter.
Should I use the weekly or monthly option chain to sell premium?
Check both before choosing. The weekly chain generally carries tighter spreads and more volume near the current expiry, while the monthly chain can show a flatter IV curve across a wider band, which suits a seller wanting less day-to-day gamma risk.