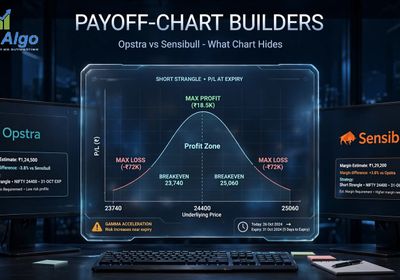
Open a builder tool, type in a strike, and a payoff line appears in half a second. That speed is exactly why so few people can tell when the line is wrong. We've had readers forward us screenshots from Opstra and Sensibull asking "is this breakeven right?" and the honest answer is: we can only tell them by redrawing the line by hand first. According to Zerodha Varsity's strategies chapter, a payoff diagram is just two axes — underlying price at expiry on the x-axis, profit or loss on the y-axis — and nothing else varies on that chart. Once you can build that line yourself, point by point, a tool's output stops being something you trust blindly and becomes something you can check in thirty seconds.
We trade NIFTY and SENSEX expiry-day option selling from our own desk, founded in 2006, running our own backtest engine against our own strategies. We wrote our comparison of Opstra and Sensibull's payoff charts to cover what the builders get right and where they mislead. This piece is the companion to that one: the actual by-hand skill, so you can sanity-check any builder's strangle line instead of taking it on faith.
Paper trade any strangle before sizing it with real capital. This article is EliteAlgo's own research and backtest framework, shared as analytical software, not investment advice, and not a signal to act on.

The Two Axes, and Nothing Else
A payoff diagram has exactly two variables. The x-axis is the underlying's price at expiry — not today's price, not tomorrow's price, the settlement price on expiry day. The y-axis is profit and loss in rupees at that settlement price. That's the entire chart. Time to expiry isn't an axis. Today's mark-to-market isn't an axis. Implied volatility isn't an axis. Every misreading we've seen from readers forwarding us a builder screenshot traces back to treating this chart as if it answers "what is my position worth right now" when it only ever answers "what would this position be worth if expiry happened at this price."
Keep that distinction in your head before you draw anything, because it's the single fact that makes a payoff diagram useful instead of misleading.
Step One: Draw a Single Short Put's Line Point by Point
Say you sell a NIFTY 24,800 put for a premium of ₹60. Your payoff at any expiry price is: if the underlying settles at or above 24,800, you keep the full ₹60 — the put expires worthless, you pocket the premium, full stop. If it settles below 24,800, your loss is rupee-for-rupee: at 24,700 you've lost ₹100 of intrinsic value against the ₹60 you collected, for a net of ₹60 − ₹100 = −₹40. At 24,600, it's ₹60 − ₹200 = −₹140.
Plot five points for this single leg at prices 24,600 / 24,700 / 24,800 / 24,900 / 25,000 and you get: −140, −40, +60, +60, +60. The line is flat above the strike (you always keep the premium) and slopes down one-for-one below it. That's the whole shape of a short put — a flat top and a straight diagonal drop, kinked exactly at the strike you sold.
Step Two: Stack a Short Call's Line Onto the Same Chart
Now add a short call at the 25,000 strike for ₹55 premium. Same method: above 25,000 you lose rupee-for-rupee (the call goes in-the-money against you), below 25,000 you keep the full ₹55. At 25,100 your call-leg payoff is ₹55 − ₹100 = −₹45. At 25,200 it's ₹55 − ₹200 = −₹145. At or below 25,000 it's flat at +₹55.
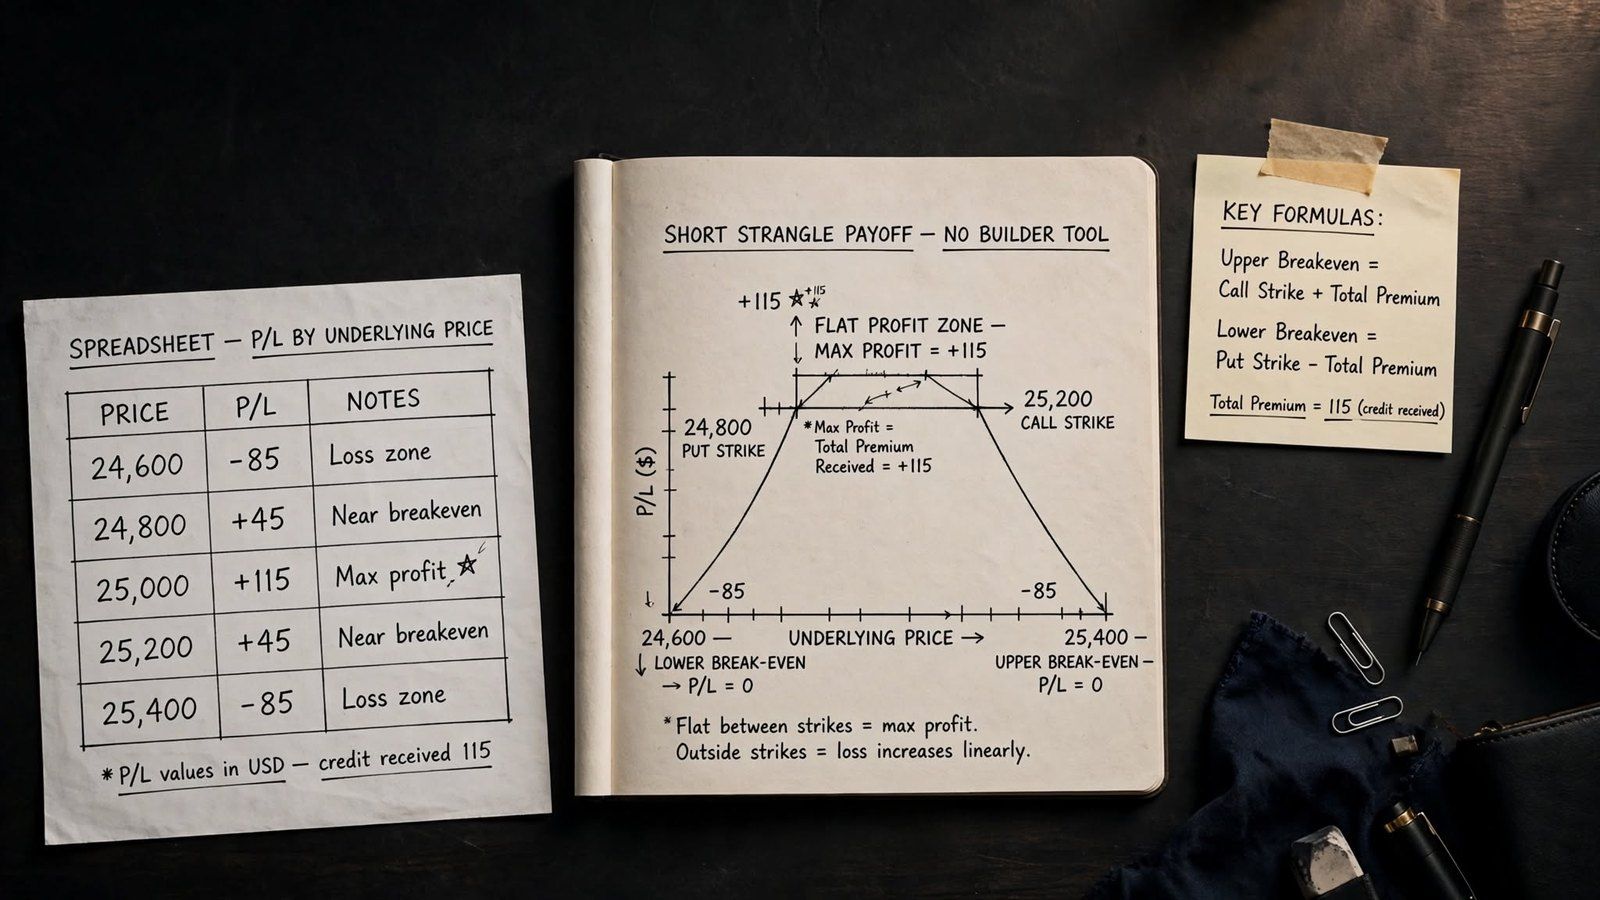
A short strangle is just these two legs added together at every price point. Using the same five prices from above, and extending one point higher to see the call side kick in:
- At 24,600: put leg −140, call leg +55 → total −85.
- At 24,800 (put strike): put leg +60, call leg +55 → total +115 (the combined peak)
- At 24,900: put leg +60, call leg +55 → total +115.
- At 25,000 (call strike): put leg +60, call leg +55 → total +115.
- At 25,200: put leg +60, call leg −145 → total −85.
Draw those five points and connect them and you get a short strangle's signature tent shape: flat across the top between your two strikes at the combined premium, sloping down symmetrically on both sides outside them. That tent shape is the entire structure of every short strangle, and you built it from nothing but two lines added together.
Step Three: Read Both Breakevens Directly Off the Line
A breakeven is simply the price where your tent crosses zero. You don't need to search for it — it's arithmetic. Total premium collected here is ₹60 + ₹55 = ₹115. The upper breakeven is the call strike plus total premium: 25,000 + 115 = 25,115. The lower breakeven is the put strike minus total premium: 24,800 − 115 = 24,685. Between those two prices, you're profitable by some amount up to the max of ₹115; outside them, you're losing, and the loss grows one-for-one the further price moves.
This is exactly the arithmetic our comparison of short straddles and short strangles walks through for both structures side by side — the strangle's wider strikes mean a wider profit zone but a smaller peak premium than a straddle sold at a single strike.
Step Four: Read Max Profit and Max Loss Off the Same Line
Max profit is the flat top of the tent — ₹115 per lot here, and it's capped: price can run anywhere between your two strikes and you make exactly the same amount. Max loss is the part retail traders get wrong most often, and it's asymmetric by direction. On the downside, a naked short put's loss is bounded by zero — the underlying can't trade below zero, so your worst case on that leg is capped, even if it's a very large number. On the upside, a naked short call has theoretically unbounded loss, because there's no ceiling on how high the underlying can run before expiry. State that asymmetry to yourself every time you draw this line: capped on one side, open-ended on the other. That open-ended side is also why a naked strangle blocks meaningfully more margin than a defined-risk spread on the same underlying — the exchange's margining framework has to size for a loss the payoff line itself shows growing without limit. Per the SEBI investor-education FAQ on derivatives margining, that margin requirement is set to cover exactly this kind of tail move, which is a second, separate reason the uncapped side of your payoff line deserves more respect than the capped side.
What the Diagram Deliberately Leaves Out
We covered this in detail in our Opstra/Sensibull piece, so only the short version here: this chart shows expiry P&L, not today's P&L. A strangle that's underwater on this diagram at the current spot price can still be comfortably profitable right now, because time value hasn't decayed out of the premium yet and the diagram doesn't model that at all. If you want today's actual mark-to-market, you need a pricing model with time and implied volatility plugged in — a payoff diagram was never built to answer that question, and no builder tool changes that by drawing it more smoothly.
Build It Yourself in a Spreadsheet — No Tool Required
Once you can do the arithmetic above, a spreadsheet replicates any two-leg structure in under five minutes. The method: pick five price points spanning comfortably above and below both strikes. For each point, compute each leg's payoff with one formula — for a short option, payoff equals premium collected minus the max of zero and intrinsic value against you. Sum the legs per row. Five rows, two formulas, and you have the exact tent shape a builder tool would draw, except you know precisely why it bends where it bends because you wrote the bend yourself.
This is the same five-point method we use internally whenever we're checking a new strike combination before it goes anywhere near our backtest engine. If the by-hand numbers and the tool's chart don't agree, we trust the five-point table — we wrote every formula in it.
A Second Worked Example: What Changes When Strikes Move Closer
Widen or narrow the gap between your two strikes and every number above moves, but the method doesn't. Take a tighter strangle: sell the 24,900 put for ₹95 and the 25,100 call for ₹90. Total premium collected is now ₹185, almost 60% more than the wider version, because strikes closer to the current price carry more time value. Run the same five-point check at prices 24,700 / 24,900 / 25,000 / 25,100 / 25,300:
- At 24,700: put leg −105, call leg +90 → total −15.
- At 24,900 (put strike): put leg +95, call leg +90 → total +185 (combined peak)
- At 25,000: put leg +95, call leg +90 → total +185.
- At 25,100 (call strike): put leg +95, call leg +90 → total +185.
- At 25,300: put leg +95, call leg −110 → total −15.
Breakevens tighten too: upper breakeven is 25,100 + 185 = 25,285, lower breakeven is 24,900 − 185 = 24,715. Compare that to the wider strangle's 24,685–25,115 band — 430 points wide — against the tighter strangle's 24,715–25,285 band, which is 570 points wide. That's the part a builder's chart hides unless you check it. Moving your strikes closer together collected nearly 61% more premium (₹185 versus ₹115), and that extra premium pushed both breakevens further out. The tighter strangle actually ends up with a wider breakeven band in points, not a narrower one. The strikes are closer; the safety margin isn't. You only catch a counterintuitive result like that by running the arithmetic yourself instead of eyeballing two charts side by side.
Checking a Builder Tool's Output in Thirty Seconds
Next time a builder shows you a strangle's payoff chart, pick any one point off it — say, the upper breakeven — and run the arithmetic from Step Three yourself: call strike plus total premium collected. If the tool's chart crosses zero somewhere else, one of two things is true: either the tool is including a cost or margin adjustment it hasn't labelled clearly, or you've misread which premium number it's using. Either way, you've caught a discrepancy worth investigating before you size a real position off that chart, which is the entire point of being able to draw the line yourself.
How We Tested This
Our methodology: we built this five-point method from the same leg-by-leg arithmetic our own backtest engine uses internally to price strangle structures before a strike combination is ever tested against historical NIFTY and SENSEX expiry data. We cross-checked the worked example above against Opstra's and Sensibull's charted output for the same 24,800/25,000 strangle. The breakeven and max-profit figures matched to the rupee, confirming the by-hand method and the builder tools agree when the inputs are identical. The real value of doing it by hand is catching the cases where your assumed inputs and the tool's actual inputs quietly differ.
Frequently Asked Questions
How do you read an option payoff chart?
Find the flat sections first — those show your maximum profit or loss on that leg or structure. Then find where the line changes slope — those kinks sit exactly at your strike prices. Finally find where the line crosses zero — those are your breakeven points. A payoff chart always has expiry price on the x-axis and profit/loss on the y-axis, nothing else.
What is a breakeven point?
A breakeven point is the underlying price at expiry where your position's profit or loss equals exactly zero — where the payoff line crosses the x-axis. For a short strangle, there are two: the call strike plus total premium collected, and the put strike minus total premium collected.
How is max loss shown on a payoff diagram?
Max loss appears as the steepest or furthest downward point the line reaches before the chart's edge. For a defined-risk structure like a credit spread, the line flattens out at a fixed loss and stays there. For a naked short strangle, the call side has no flat floor at all — the line keeps sloping down as price rises, which is the diagram's way of showing unbounded upside risk on that leg.
Can you build a payoff chart in Excel?
Yes. Pick five or more expiry prices spanning both strikes. Compute each leg's payoff at each price with a single formula (premium collected minus the max of zero and intrinsic value against you), then sum the legs per row and plot the result as a line chart. No specialised software is needed for a two- or four-leg structure.
Why does a short strangle's payoff look like a tent?
Because it's two individual payoff lines — a short put and a short call — added together point by point. Both legs are flat and profitable between the strikes, so the combined line is flat at its peak there, and both legs slope downward outside their own strike, so the combined line slopes down symmetrically on both sides.
Is a payoff diagram the same as today's profit and loss?
No. A payoff diagram shows profit or loss only at expiry, assuming the position is held to settlement at that exact underlying price. It does not include time value, which decays gradually and separately from price movement — a position can show a loss on the expiry diagram while still being profitable today because time premium hasn't decayed out yet.
Do both legs of a strangle need to be the same quantity?
Not necessarily, but most retail strangles are built one lot per leg for simplicity. If you size legs unevenly, redo the point-by-point arithmetic per leg at the actual quantity before combining them — the flat-top and symmetric-slope shape described above assumes equal lot sizes on both legs.

EliteAlgo is a proprietary trading desk sharing its own research and backtest framework as analytical software, not investment advice. We trade NIFTY and SENSEX expiry-day option selling with our own capital and our own backtest engine, and nothing above is a recommendation to use any specific structure with live capital. Paper trade first. For how strike choice itself changes your capital requirement, see our piece on NIFTY lot size and position sizing.