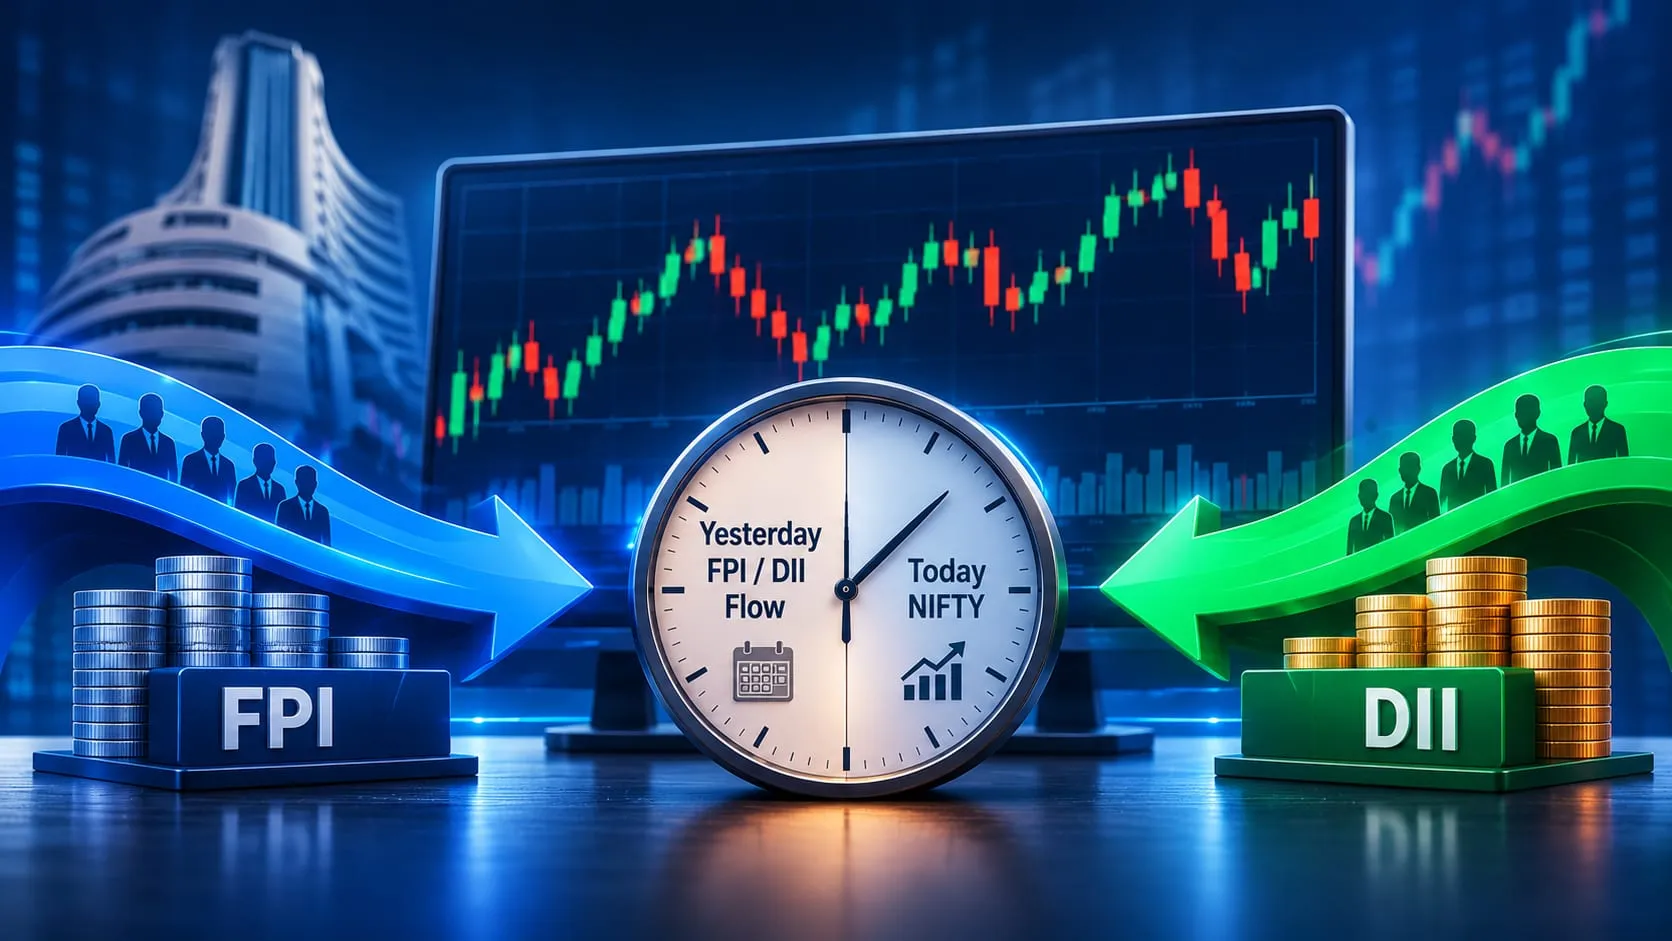
Open any market app before 9 a.m. and you'll find a line like "FPIs sold ₹3,200 crore on Tuesday, DIIs bought ₹2,900 crore." The numbers are large, they're tidy, and they sit right next to the day's headline, so they read like an explanation. Foreign money left, so the index fell. Domestic money stepped in, so it recovered.
We run a NIFTY and SENSEX expiry-day option-selling desk, and our team has spent years deciding which inputs deserve a place in a strike-selection rule. Daily FPI and DII flow is one we get asked about constantly. This piece defines the terms properly, then tests the question that matters to a seller: does a flow figure you can read this morning tell you anything useful about the range NIFTY will cover today?
Paper trade this first. Before you let any flow-data reading influence a live strike, wing width or position size, run the idea on paper for several expiries and record what the figure said against what the session did. This article is EliteAlgo's own research, shared as analytical software and not as investment advice, a tip or a signal to trade.

What Is Foreign Portfolio Investment?
Foreign portfolio investment (FPI) is money that foreign entities put into Indian financial securities, such as listed shares, bonds and similar instruments, without taking control of a business. The investor is buying a position that can be sold again on the same day, which is the whole point of the route. Registered foreign funds, pension and sovereign funds, and asset managers use it to hold Indian paper alongside the rest of their global book.
The regulator's own page on the subject, the SEBI foreign portfolio investors section, is the place to read how the category is defined and who may use it. Per the SEBI FPI framework, these investors register through designated depositary participants and then trade through the normal exchange system. That detail matters later, because it explains why the data exists in the first place: registered investors, a depository record, a daily tally.
FPI versus FDI, in one paragraph
Foreign direct investment (FDI) is the other half of "foreign money", and it behaves nothing like FPI. FDI means a foreign entity takes a lasting, usually controlling stake in a business: a factory, a subsidiary, a large equity block with a say in how the company runs. It moves slowly, it's negotiated, and nobody settles it on a screen between 9:15 a.m. and 3:30 p.m. FPI is the liquid, tradeable kind. When a news line says "foreign money is flowing out of Indian markets", it nearly always means FPI. Mixing the two up is the most common mistake we see, and it's why a search for the term often lands on articles about something else.
What Do DII Numbers Measure?
DII stands for domestic institutional investors: mutual funds, insurance companies and similar institutions registered in India. The daily DII figure is the net of what those institutions bought minus what they sold. It's published alongside the FPI number on the same cadence, which is why the two are almost always quoted as a pair.
Mutual funds have a structural feature that shapes the DII line. Monthly systematic investment plans bring in steady cash that the fund managers have to deploy whether or not they like the market that week. In our experience that makes DII buying look "defensive" on down days, because there's a base level of buying that happens regardless. It's not a view. It's a plumbing effect, and it's worth remembering when a headline says domestic institutions "stepped in to support the market".
Why Do These Numbers Get Quoted Every Morning?
Three reasons, and none of them is predictive power.
They're big. A net figure in the thousands of crore feels like it must matter. They're clean: one number for foreigners, one for domestic institutions, positive or negative, easy to put in a headline or a ticker. And they come with a built-in story. If the market fell and FPIs sold, the cause seems obvious. If the market rose and DIIs bought, the cause seems obvious too.
The trouble is that a number which fits every outcome after the fact is describing the day, not forecasting it. Ease of reporting and usefulness for decisions are different qualities. Plenty of things are easy to report. Fewer help you size a strangle.
When Are FPI and DII Figures Actually Published?
This is the single most important fact for an intraday seller, and it settles most of the debate before any statistics get involved.
The exchanges publish provisional FPI and DII net figures for a trading day after that day's market has closed, typically in the evening. The depositories then publish their own FPI activity data on their own schedule, and those figures are usually a day or more behind. You can see the layout of that data on the NSDL FPI monitor, which breaks activity down by asset class and sector. Source: NSE and depository publication timetables, which you should check yourself since they have shifted over the years.
Follow that through. At 9:20 a.m. on Wednesday, the newest flow number available to you describes Tuesday. It was generated by Tuesday's trades, in Tuesday's volatility, at Tuesday's prices. Nothing in it knows that Wednesday opened gap-up, or that the previous night's US session closed weak, or that crude moved overnight. By the time you read the figure, the market has already priced everything that produced it.
So the morning flow number is a lagging description of yesterday. Treating it as a live signal for today is a timing error before it's an analytical one.
The two ways people try to use it anyway
The first is "yesterday's flow predicts today's direction": heavy FPI selling yesterday, so be cautious today. The second is "today's flow is visible during the session": some data vendors and TV tickers show estimated or live-ish flow during the day. Both have the same weakness. The first uses information that is stale by the time you see it. The second uses partial, unverified information that tends to get revised, and it describes activity you're already looking at in the price.
Does FPI or DII Flow Move NIFTY Intraday?
Here's the honest answer: flow and index direction move together on the same day, but that's not the question a seller needs answered, and the relationship gets weak when you shift the flow figure forward by one session.
Let's separate three questions, because they get blurred in almost every market brief.
- Same-day: on days FPIs sold heavily, did NIFTY tend to fall? Often yes. That's unsurprising. Foreign selling is one of the things that pushes the index down, and a falling index prompts more selling. The flow is part of the move, so of course they correlate.
- Next-day: given yesterday's flow, what does today's range or direction look like? This is the question a morning reader can act on. The relationship we see here is weak and unstable.
- Multi-day: after five or ten sessions of one-directional flow, does anything change about how the market behaves? Slightly more useful, but still not a trigger.
Only the second one is usable at 9 a.m., and it's the one with almost no signal.
How we looked at it
We compared published net flow figures against NIFTY's next-session behaviour using our own backtest framework, then checked how often a rule such as "skip the strangle after heavy FPI selling" would have changed the outcome. The test setup was simple on purpose: yesterday's net FPI and DII figures, bucketed by size, against the next day's open-to-close range and direction. We're not publishing a table of results here, because a small sample of expiry days can be made to say almost anything and we'd rather not hand you a false precision. What we're comfortable stating is the shape of what we saw: next-day direction after large flow days looked close to a coin toss, and next-day range showed no stable relationship with the size of the previous day's flow that survived changing the bucket edges.
That last clause is the test we care about. If a pattern disappears when you move the threshold from ₹2,000 crore to ₹2,500 crore, it was never a pattern. It was one particular run of days. Per the same logic we apply to every rule on our desk, a signal has to survive reasonable changes to its own parameters before it's allowed near live capital.
A worked illustration (round numbers, not a real trade)
Suppose FPIs net-sold ₹4,500 crore on a Monday and NIFTY closed down 0.8% at 24,100. On Tuesday morning the headlines frame it as "foreign outflows weigh on markets". A seller who takes that framing literally might widen the put side of a strangle, expecting more weakness.
Now suppose Tuesday opens 40 points higher because the overnight global tone improved, and NIFTY spends the day in a 130-point range around 24,150. The put side the seller widened out of caution gave up premium for a fall that never arrived. The flow figure wasn't wrong. It accurately described Monday. It just didn't describe Tuesday.
Reverse it and the same trap appears. A big DII buying day gets read as "support", the seller tightens the put side, and a gap-down from a global event runs straight through it. Whichever way you try it, the figure arrives after the information it summarises.
Why Does Flow Data Feel Predictive Anyway?
Because of how stories get built after a session. A day ends, the index is up or down, and the commentator looks for a cause among the numbers that just came out. Flow is always among them. If foreigners were net sellers on a down day, the story writes itself. If they were net buyers on a down day, the story is "DIIs absorbed the selling" or "FPIs bought the dip", and that writes itself just as well.
A good test of any indicator is whether it can be wrong. A figure that supports a bullish story on up days and a bearish story on down days, and can be spun as "absorption" on days that go against it, has never been tested in a way it could fail. That's a property of the narrative, not of the data.
What Flow Data Is Actually Good For
None of this makes the numbers worthless. They're good at telling you about context over weeks, not about timing over hours.
A sustained run of one-directional foreign flow, say two or three weeks of net selling, tells you something about the broad mood and about how much one-sided pressure the index has been carrying. It says little about Thursday's expiry. It can say something about whether the recent week has been unusually one-sided and whether you'd be comfortable with the usual wing distance given that.
That's the same character as the point we make about implied volatility. In our explanation of implied volatility, the central idea is that IV prices uncertainty, not direction. Flow data is similar. It describes sentiment and context. It doesn't hand you a trigger for one particular session's range.
A modest, defensible use
If you want flow to play any role in an option-selling process, here's the version we'd consider, and it comes with limits.
- Use a multi-day streak, not a single day. One large print is noise; ten sessions pointing the same way is a pattern worth noticing.
- Use it as one input among several when you size wings for the week, next to VIX level, the event calendar and where the index sits relative to its recent range.
- Never use it as a stand-alone entry or exit trigger.
- Write down in advance what you'll do differently, and by how much, so you can check afterwards whether the adjustment helped or just felt careful.
Paper trade this first. If a flow streak is going to influence wing width or strike distance on your desk, test that adjustment on paper across a meaningful number of expiries before it touches live capital, and compare it against the same strangle with no flow adjustment.
For the volatility side of the same sizing decision, our walkthrough of an India VIX premium budget for a short strangle shows how we turn a VIX reading into a concrete premium and strike-distance range. Flow can sit next to that as colour. It can't replace it.
How Flow Compares With Other Inputs Sellers Talk About
Option sellers collect a lot of inputs, and it helps to rank them by how much they actually pin down about today's session.
India VIX tells you how much movement option prices imply for the coming month, and the premium on the day tells you what the market charges for that risk right now. Both are live, both are in the price you're going to trade. Open interest by strike shows where positions are concentrated, although, as we argued in our piece on NIFTY OI data without the folklore, that data gets over-read too. The event calendar, such as a policy decision or a result from an index heavyweight, tells you when ranges tend to break.
Flow figures are the odd one out, because they're the only one in that list that is published after the session it describes. That puts them at the bottom of the list for timing, however prominently the headline places them.
Common Mistakes When Reading FPI and DII Data
A few errors come up again and again, and most of them are about reading rather than maths.
Reading cash-market flow as the whole story. The headline figure usually covers cash equity activity. Foreign investors also take positions in index futures and options, and a seller who knows the derivatives side is where the real positioning happens will treat the cash number as one slice only.
Treating a net figure as a view. A net of zero can hide enormous gross buying and selling on both sides. A large net can come from one block deal. The label "FPI selling" gives the impression of a coordinated decision, when it's thousands of separate orders for separate reasons: rebalancing, redemptions, currency moves, tax-year effects.
Comparing across different sources without checking definitions. Exchange provisional data, depository data and vendor estimates can differ in timing, in what asset classes they include and in how they treat debt. When two numbers disagree, check what each one counts before deciding which one is right.
Anchoring to a threshold. "Above ₹5,000 crore means trouble" is a story, not a rule, unless it's been tested across parameter changes and enough sessions to mean something. We haven't found one that holds.
What We Would Not Do
We wouldn't skip a trade because yesterday's FPI figure was negative. We wouldn't add a leg because DII buying looked strong. And we wouldn't adjust a stop-loss because a ticker line changed colour. Every one of those turns a lagging report into a live decision.
What we would do is keep a simple log. Each expiry, note the previous session's flow figures next to the day's actual range, and add a row. After a few months you'll have your own data on whether the number tells you anything about your instrument and your strikes. That's more useful than our opinion or any commentator's, and it's the habit behind our approach to paper trading an option-selling algo.
Where Our Evidence Stops
We'd rather be plain about the limits. We haven't published a flow study with a full sample, and nothing here should be read as a measured edge in either direction. What we can say is that the timing problem is structural, so it doesn't depend on any dataset, and that in our own testing the next-day relationship was too weak and too unstable to build a rule on.
It's possible a more refined version of the data, such as flows split by investor category or combined with derivatives positioning, carries more information. If it does, the same discipline applies: it has to survive parameter changes, a meaningful sample and a paper-trading period before it earns a place.
The Short Version
FPI and DII figures are real, large and worth knowing. They describe what institutions did yesterday. They don't tell you what NIFTY will do today, and they arrive too late to be a trigger. Use a multi-day streak as background when you think about wing distance, keep it small next to VIX and the event calendar, and paper trade any adjustment before it touches live capital.
Frequently Asked Questions
What is foreign portfolio investment?
Foreign portfolio investment is money foreign entities put into Indian shares, bonds and similar securities without taking control of a company. It's liquid: positions can be bought and sold on the same day. Registered foreign funds, pension funds and asset managers use this route.
What is the difference between FPI and FDI?
FDI is a lasting, usually controlling stake in a business and moves slowly. FPI is a tradeable holding in listed securities and can reverse within a day. When a headline talks about foreign money leaving Indian markets, it nearly always means FPI.
Do FPI and DII numbers predict NIFTY's direction?
Not in any way you can use at the open. Flow and the index move together on the same day, but that's partly because flow is part of the move. The relationship between yesterday's flow and today's direction was weak and unstable in our own testing.
When are FPI and DII figures published?
Provisional exchange figures for a trading day come out after the market closes, typically in the evening. Depository FPI data follows on its own schedule and is often a day or more behind. Check the current timetable on the NSE and NSDL sites.
Should option sellers track FPI flows?
As background, yes. A multi-day streak of one-directional flow is one input when you size wings for the week. As a trigger for entry, exit or stop changes, no. Paper trade any flow-based adjustment first.
Why do news channels quote FPI and DII flow every morning?
Because the figures are large, simple to report and fit any story after the fact. That makes them good headlines, but it doesn't make them good timing signals.
Is the DII figure a bet against foreign selling?
Not usually. Mutual funds receive regular SIP cash that has to be invested, so a base level of DII buying happens regardless of view. It looks like support on down days partly because of that plumbing.
Does EliteAlgo sell flow-based signals?
No. EliteAlgo is a proprietary trading desk. It trades its own capital with its own backtested rules and publishes research as analytical software, not investment advice. It doesn't sell tips or signals.

Further reading: the SEBI foreign portfolio investors page, the NSDL FPI monitor, the NSE website for daily provisional figures, and the IMF for how balance-of-payments statistics classify portfolio versus direct investment.
EliteAlgo is a proprietary trading desk sharing its own research and backtest framework as analytical software, not investment advice. We trade NIFTY and SENSEX expiry-day option selling with our own capital and our own backtest engine, and nothing above is a recommendation to use any specific strike, size or flow-based rule.