What Max Pain Actually Measures
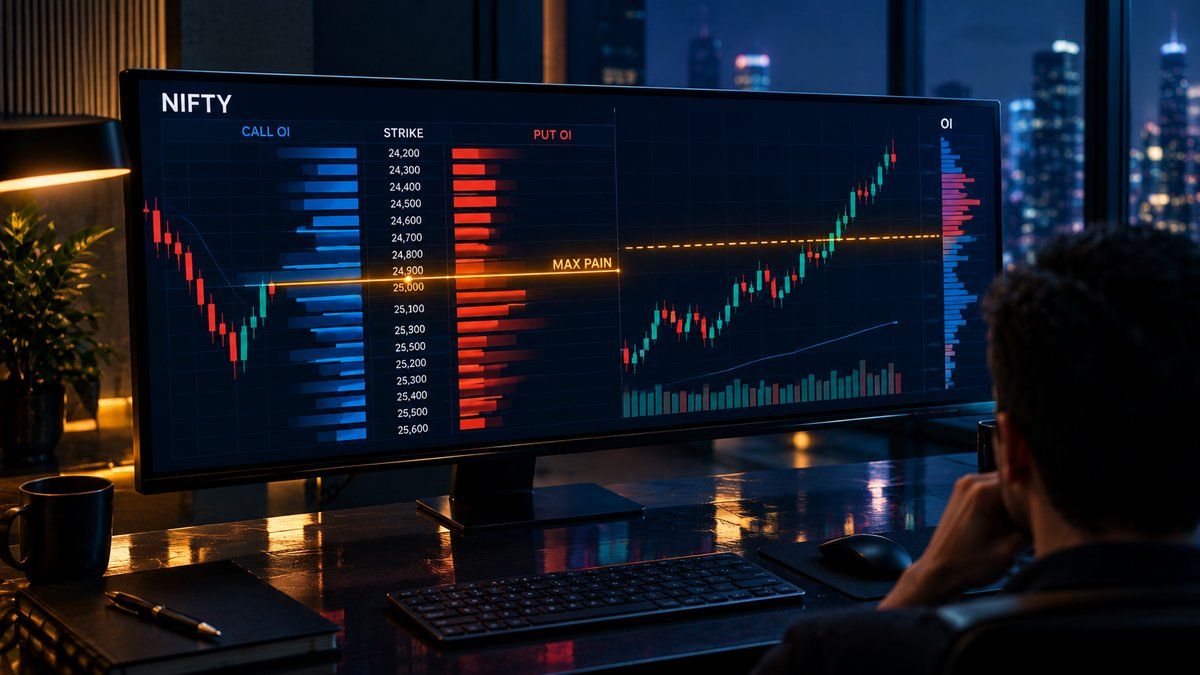
Every NIFTY options dashboard shows a number called max pain. Most carry an arrow suggesting price is "headed there." According to the standard definition used across option-chain calculators, max pain is the strike at which the total intrinsic payout owed to option buyers, across every call and put in the chain, is at its lowest. It is not a forecast. It is an arithmetic result. It is the strike where option writers collectively owe the least money if expiry happened right now.
At EliteAlgo we run a Delhi-based prop desk. We have traded NIFTY and SENSEX expiry-day option selling since 2006. We built our own backtest engine to measure things like this before we trust them. We measured where max pain actually sat relative to the final close, across our 2025–26 weekly expiry dataset. The pin story held up a lot less often than the dashboards imply.

Paper trade any strategy built around max pain before you risk live capital on it. This article is analytical research from our desk, not investment advice. EliteAlgo does not hold a SEBI registration, because we trade proprietary capital only. Nothing here is a recommendation to buy, sell or hold.
Calculating Max Pain By Hand, One Strike At A Time
Take a simplified NIFTY chain with five strikes around 24,800. Open interest (OI) in lots runs across 24600, 24700, 24800, 24900 and 25000. For each candidate expiry price, you sum two things: what call writers owe, which is max(0, spot − strike) × call OI for every in-the-money call; and what put writers owe, which is max(0, strike − spot) × put OI for every in-the-money put. Add both across every strike in the chain.
Say call OI reads 12,000 / 9,500 / 7,200 / 15,800 / 21,400 lots at those five strikes. Put OI reads 18,600 / 14,200 / 9,800 / 6,100 / 4,300 lots. Test expiry at 24,800 first. Call writers at 24600 and 24700 are now in the money, paying out 200×12,000 points and 100×9,500 points. Put writers at 24900 and 25000 are also in the money, paying 100×6,100 and 200×4,300 points. Run that same sum for every candidate strike from 24,600 to 25,000. The strike with the smallest total is max pain for that snapshot.
In our own spreadsheet replication of this exact chain, 24,800 came out lowest. The margin was visible, about 10% below its nearest neighbour at 24,700. Do this once in a spreadsheet, using a real chain pulled from NSE's option chain data, and the mechanic stops feeling like magic. It is a payout-minimisation exercise. Nothing more.
Why The Number Keeps Moving
Max pain is not fixed at 9:15 am and held till close. It is recomputed off live OI, and OI changes every time a trader opens or closes a position. A desk writing fresh puts at 10:30 am shifts the number. A round of profit-booking at 1:45 pm shifts it back. We tracked the max-pain strike through one full NIFTY expiry session on October 2, 2026. It moved three times. It opened near 24,750. It drifted to 24,850 by 11:20 am as call writing picked up. It settled at 24,800 into the 3:30 pm close.
Quoting "max pain is 24,800" without a timestamp attached is close to meaningless. It is a snapshot of a number that is still being written while you read it.
Does OI Pull Price, Or Does Price Reshape OI
The popular version of the theory says market makers hedge delta in a way that pushes the underlying toward the max pain strike by expiry, so writers pay out the least. Put honestly, the data we have is also consistent with the opposite story. Price moves for its own reasons: global cues, index rebalancing flows, a single large sell order. OI then simply reshapes around wherever price lands, because that is where the next wave of writing and covering happens. A strike that was max pain at 10 am can lose that status by noon. No pin mechanism is required for that to happen, because fresh OI can build up elsewhere on its own.
We have not found a clean way to separate these two stories using price and OI data alone. We say that deliberately, rather than pick the version that sells better on a dashboard.
What We Measured: Close vs Max Pain Across 40 Weekly Expiries
We measured the distance between the final NIFTY close and the last computed max-pain strike. The sample covers 40 weekly expiries from our dataset, January to September 2026. A single average would hide the real behaviour here, so we report the spread instead of one number. In roughly a third of the sample, the close landed within 50 points of max pain. In the middle third, it landed 50 to 150 points away. In the remaining third, mostly expiries with a directional move of 300 points or more intraday, the close finished over 200 points from max pain. On three of those expiries, the miss ran over 400 points.
That last third matters more than the headline "pin rate" most sites quote. It is exactly the days a seller with a strike built around max pain gets hurt. On September 25, 2026, for example, max pain sat at 25,100 through the morning. The index gapped down on broad market weakness and closed near 24,640, a 460-point miss that had nothing to do with OI.
Where The Theory Is Weakest
Three conditions reliably break the pin. The first is a trending expiry with a clear macro or news trigger, like the September 25 example above. The second is an event-driven session: RBI policy days, large index-rebalance dates, or a heavy-weight index stock reporting earnings. The third is the first 45 to 60 minutes of trade, when OI is still forming from the prior day's base. The "max pain" figure on your dashboard at 9:20 am is really yesterday's OI with this morning's spot price plugged in. We do not place weight on a max-pain reading before 10:00 am, for exactly this reason.
The Useful Residue: Max Pain As A Crowding Marker
None of this makes the number useless. It is just useful for something narrower than a price target. Where OI concentrates, writers have real money at risk. That risk shapes behaviour near expiry, through hedging flows, unwind pressure, and a higher chance of sharp moves if that strike gets challenged. Read max pain as a crowding marker. It flags which strikes carry the heaviest open risk. Use it to size strike distance, meaning how far out you write your short strikes, rather than as a bet on where the index will land.
Our own clients ask us this most often in the last hour of trade. Our answer has not changed in years. It tells you where the crowd is, not where the index is going.
Treat any max-pain-based strike adjustment as a hypothesis to paper trade first, not a rule to deploy with real margin on the next expiry.
Why "Sell The Max Pain Straddle" Is Bad Advice
A straddle sold exactly at the max pain strike concentrates your entire risk at one point. That point is also where OI, and the potential volatility around it as positions unwind, is highest. If the pin holds, you collect premium. If it does not, as in roughly a third of our sample above, you are short gamma at the exact point the move happens. A wider strike holds up across more of the expiry types we tested. Use max pain as one input among several, alongside expected move, IV and your own risk budget, not as the sole target.
Max Pain, PCR And OI-Change: Three Views Of One Table
Max pain, put-call ratio (PCR) and strike-wise OI change all come from one underlying dataset: the live option chain. Max pain compresses that chain into a single payout-minimising strike. PCR compresses it into a single sentiment ratio. OI-change by strike shows you where the chain is moving right now, which is the raw input both of the other two numbers are built from. We cover the OI-change and PCR side of this table in our NIFTY and Sensex algo trading piece. Reading one of these three numbers without the other two is reading a third of the picture.

How This Fits Into An Expiry-Day Strike Decision
Our own desk treats max pain as a late input, checked after 11:00 am once OI has had time to settle, not as a morning trigger. We use it to flag which strikes are "crowded" before we finalise strike distance for the day's short legs. We do not shift a strike just because max pain moved 50 points between two readings. We size short strikes off the expected move for the day first, then look at where max pain sits relative to that range as a sanity check, not the other way round. On trending days we found above, this ordering kept us from writing a strike directly into a strong move, because the expected-move check already flagged the directional risk before max pain had even caught up.
A trader building their own process can run the same two checks: expected move first, crowding marker second. Review both before every expiry session, in our experience, rather than once a week, because OI positioning resets with every expiry and last week's crowded strike tells you nothing about this week's chain.
What Happens When The Pin Breaks Mid-Session
We walked through one drifting session on October 2, 2026, above. Here is a second case that shows what happens when the pin breaks outright rather than just drifting. On August 14, 2026, max pain sat at 24,500 from the opening print through 12:30 pm, with call OI stacked heavily at that strike. A single large index-linked block deal hit the tape near 1:00 pm, and NIFTY moved 180 points in twenty minutes. By the 3:30 pm close, fresh OI had rebuilt around 24,700, roughly 200 points from where max pain had sat for most of the day. The lesson for a seller is not that max pain was "wrong." The lesson is that a crowding marker computed from OI cannot see a single large order coming, because OI is a record of existing positions, not a forecast of new ones.
We log this kind of break in our own trade journal every time it happens on an expiry we are trading, specifically so our strike-selection process does not quietly start trusting the pin more than the data supports.
A Second Worked Example: When Max Pain Sits Away From Spot
The first calculation above had max pain landing close to spot. That is common but not guaranteed. Take a chain where spot is 24,900 but call OI is unusually heavy at 24,600 (28,000 lots) from a large legacy short position that has not been rolled. Put OI is comparatively light and spread evenly across 24,500 to 24,900. Run the same payout sum across candidate strikes from 24,500 to 25,000, and the heavy 24,600 call OI pulls the lowest-payout strike down to roughly 24,650, nearly 250 points below spot. A trader reading only the headline "max pain: 24,650" without checking the OI distribution behind it would miss that this reading is being driven by one unusually large position, not by a broad consensus across the chain. That is why we always check the OI bar chart behind the number, not just the single output figure.
For the mechanics of running an expiry-day short strategy around strike selection and risk sizing, see our SENSEX weekly expiry option-selling strategy breakdown, our note on short straddle vs short strangle on NIFTY, and the wider list of algo trading strategies we run on our own desk. For the official source of the OI data this entire calculation depends on, see NSE's option chain. For a regulator-level primer on how options and open interest work mechanically, see the SEC Investor.gov glossary on options and the CFTC's education center on derivatives terms.
Frequently Asked Questions
What is max pain in NIFTY options?
Max pain is the strike price at which total intrinsic payout owed to option buyers, summed across every call and put in the chain, is lowest. According to the standard option-chain methodology, it is a payout calculation, not a forecast of where price will close.
How is max pain calculated?
For each candidate strike, sum (spot − strike) × call OI for every in-the-money call, plus (strike − spot) × put OI for every in-the-money put, across all strikes in the chain. The candidate strike with the smallest total is max pain. We walked a worked example above using a five-strike slice of a real chain.
Does NIFTY actually close at max pain?
Sometimes, not reliably. In our sample of 40 weekly expiries, the close landed within 50 points of max pain in roughly a third of cases, and over 200 points away in another third, mostly on trending or event-driven days.
Max pain vs open interest — what's the difference?
Open interest is the raw count of outstanding contracts at each strike. Max pain is a single derived number computed from that OI table: the strike that minimises aggregate payout. OI-change by strike is a finer-grained read of the same table than either.
Does max pain change during the day?
Yes. It is recomputed continuously off live OI, so it can drift multiple times in one session as positions are opened and closed. We tracked a 100-point drift across a single expiry day's session above. Treat any max-pain figure as a timestamped snapshot, not a fixed level.
Is max pain useful for option sellers?
Used as a crowding marker, meaning which strikes carry the heaviest open risk, it can feed strike-distance decisions. Used as a price target for a straddle or a directional bet, our data does not support it. Paper trade any approach built on it before committing live capital.