
Quick Answer
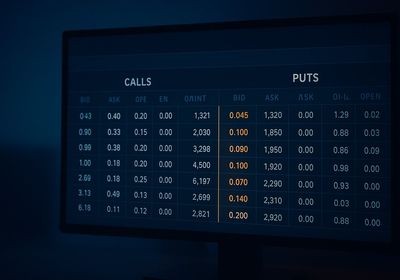
"Historical options data" for Indian index options is not one thing. At minimum a usable record needs, per contract per timestamp: the underlying's price, the option's own price, the strike, the expiry date and the option type. Three further fields decide what questions you can ask of it — bid and ask (without which you cannot model execution), volume and open interest (without which you cannot tell whether the strike was tradeable) and implied volatility (needed only if your rules reference delta or volatility).
Granularity should be chosen by the question: end of day for positional and long-horizon work, one minute for most intraday rules, tick or one second for intrabar stops and the last hour of an expiry session. The official primary source is the exchange's own published daily files and historical reports; everything else is either a licensed redistribution of those, a broker's archive, or a reconstruction. The single most important property is whether prices were captured from real trades or reconstructed from a model, because a reconstruction is smooth in exactly the violent moments that carry all the risk. Before trusting any dataset, verify lot sizes against the contract period, trade dates against the actual expiry calendar for that index, and the behaviour of far strikes near expiry against an independent source.
This page is a practitioner's guide to the data, not a data offering. We do not publish or distribute a historical options dataset, and nothing below should be read as advertising one. It is analysis, not advice, and it recommends no vendor, no platform and no trade.

What is actually in an options dataset
The reason this needs saying is that people arrive looking for "NIFTY historical data" and receive a file that is technically correct and useless for their purpose. Equity historical data is one series per symbol. Options data is a different shape entirely, and the shape is the first thing to get straight.
An index option contract is identified by four things, and all four have to be in the data or you cannot reassemble anything:
- Underlying — NIFTY, BANKNIFTY, FINNIFTY, SENSEX and so on. Each has its own contract rules and its own history of changes to them.
- Expiry date — the specific date, not "weekly" or "monthly". A row that says "weekly" without a date is unusable because the weekly expiry weekday has not been constant.
- Strike price — and the strike interval itself changes with index level and over time, so the available ladder in 2020 is not the ladder today.
- Option type — call or put.
Then, per timestamp, the fields. Here is what each one buys you and what you cannot do without it:
| Field | Why you need it | What breaks without it |
|---|---|---|
| Underlying price | Every moneyness and delta-based rule resolves against spot at that moment | You cannot determine which strike your rule would have selected |
| Option traded price | The P&L itself | Nothing works |
| Bid and ask | The spread is the dominant execution cost on options | You are implicitly assuming fills at the mid or the last print — optimistic in both directions, and badly so on thin strikes |
| Volume | Whether anything traded at that price at that moment | Your backtest will happily transact in a strike nobody touched |
| Open interest | Depth and positioning; also the basis for OI-change studies | No liquidity filter, and no OI analysis. Our view on what OI does and does not tell you is in NIFTY OI data without the folklore |
| Implied volatility | Only if your rules select by delta or reference volatility directly | Delta-band strike selection becomes impossible to reproduce. Note that IV is derived, not observed — see implied volatility explained |
| Settlement price | Any rule holding a leg into expiry | Expiry-day results are wrong by whatever the gap was between the last trade and the actual settlement calculation |
One more field that is not data but matters as much as any of them: the lot size in force for that contract period. It is usually not in the file, and it has to be joined in from the contract specifications for the right period, because it has been revised. More on that below, because it is the single most common way a rupee P&L comes out silently wrong.
The futures case, briefly
NIFTY 50 futures historical data is a simpler object — one series per expiry, with open, high, low, close, volume and open interest, plus the settlement price. It is often what people actually need when they ask for index historical data, for two reasons. First, if your strategy is directional on the index, futures history is cleaner and far smaller than the options chain. Second, futures carry the basis — the gap between the futures price and spot — which options data does not expose directly and which matters if you are studying carry or hedging.
The traps that apply are the roll and the continuity. A "continuous NIFTY futures" series is a constructed object: someone has chosen when to roll from the near contract to the next and how to adjust for the price gap at the roll. Different roll conventions produce materially different series, and a provider that does not state its convention has handed you a number you cannot reproduce. If you need the real thing, use per-expiry contracts and do your own rolling, with the convention written down.
Which granularity answers which question
This is the decision that saves the most wasted effort, because tick data is expensive and slow and most questions do not need it. The rule is simple: your data must be finer than your fastest rule.
| Granularity | Answers well | Cannot answer | Typical size |
|---|---|---|---|
| End of day | Multi-day positional strategies; long-horizon studies of premium levels, OI build-up and term structure; regime classification | Anything intraday. It cannot model a stop at all — an EOD backtest of a stopped strategy is a different strategy, not an approximation of yours | Small. Years fit comfortably on a laptop |
| One minute | Most intraday option-selling rules: fixed-time entries, fixed-time square-offs, stops evaluated at candle close, re-entry counting | Intrabar stops, and the final stretch of an expiry session where a minute can travel a long way. Generally biased in a flattering direction, because it smooths the worst prints inside each bar | Large but workable. The chain across several years is tens of gigabytes territory, depending on strike coverage |
| One second / tick | Intrabar stop logic; slippage and spread studies; order sequencing for multi-leg entries; the last hour of expiry | Nothing methodologically — the constraints are cost, storage and processing time | Very large. Plan storage and compute before acquiring, not after |
Two practical notes from doing this repeatedly. First, strike coverage matters as much as time granularity for size. A dataset that holds the full ladder is enormously larger than one holding strikes within a band of spot, and for most selling strategies a generous band around spot is sufficient — but decide the band deliberately, because widening it later usually means re-acquiring. Second, if your rules only fire at fixed clock times, minute data is genuinely sufficient and tick data buys you nothing but a longer run time. Spend the money on data quality before spending it on data frequency.
Where the data comes from, and what each source does and does not give you
There are four distinct categories, and conflating them is how people end up trusting a reconstruction.
1. The exchange's own published files
The exchanges publish daily reports for the derivatives segment, including a daily bhavcopy that carries, per contract per day, the open, high, low, close, settlement price, volume and open interest. There are also historical report sections on the exchange sites for contract-wise data, and the contract specification pages that carry the authoritative lot sizes, strike intervals and expiry calendars.
What this gives you: the authoritative end-of-day record, free, from the primary source, with settlement prices. For anything positional, for long-horizon premium and OI studies, and for verifying another dataset, this is the reference.
What it does not give you: intraday anything. The daily files are one row per contract per day. There is no minute history and no tick history in them, and no amount of processing will produce one.
A note on the live option chain many people reach for first: the chain published on the exchange site is a snapshot of now, carrying current prices, OI and IV. It is not a historical archive, and scraping it daily to build your own history is a long, fragile project that will have gaps on every day you missed. Several people start here and discover the limitation months in.
We are deliberately not reproducing file names, URL paths, archive depths or format details on this page, because the exchanges revise all of those and a stale instruction is worse than none — it sends you to a 404 with confidence. Go to the exchange's own site for the current structure, and check the download page rather than a description of it.
2. Licensed data from the exchange's data arm
The exchanges operate data businesses that license historical tick and snapshot data, typically through an application process and with terms attached to redistribution. This is the primary source for intraday history.
What it gives you: the real thing, including the market depth and the timestamp precision that the free files do not carry.
What to establish before committing: what exactly is included at each level (full depth versus best bid/ask versus trades only), what the archive depth is, what format it arrives in and how much processing stands between the delivered files and something you can query, and what the licence permits — redistribution terms in particular, since they constrain what you can build on top of it. Ask for the current terms directly; do not rely on a third-party summary, ours included.
3. Commercial vendors and backtesting platforms
Most retail users meet historical options data bundled inside a backtesting platform, or buy it from a vendor who has licensed and processed it. This is a perfectly reasonable route and it is how the great majority of retail options research actually gets done.
What it gives you: usability. Someone has already handled the ingestion, the contract roll, the strike normalisation and the query layer, and that work is substantial.
What to establish: the provenance question below, plus whether the vendor has handled the India-specific changes correctly — lot size revisions, expiry weekday changes, settlement basis. Those are the three places where processed data is most often quietly wrong. We review the platforms that bundle data, and what each one's data layer will and will not do, in our guide to options backtesting software in India. That page is where the "which one should I buy" question belongs; this page is about the data itself.
4. Broker archives and community datasets
Brokers often expose historical candle data through an API, and there are free and community-assembled options datasets in circulation.
What they give you: a fast start at low or zero cost, which is genuinely valuable for learning the mechanics and for sanity-checking your own code.
What to watch: coverage gaps, inconsistent handling of expired contracts, retention limits on how far back an API will serve, and — most importantly — no stated provenance. A dataset with no answer to "where did these prices come from" should be used to debug your pipeline, not to decide anything.
The provenance question that matters more than everything else
Ask one question of any options dataset before you ask any other: were these prices captured from real trades and quotes, or reconstructed from a model?
Some sources fill gaps in illiquid contracts by pricing them theoretically — taking the underlying's price and a volatility assumption and computing what the option "should" have been worth. For some research purposes that is defensible. For backtesting a selling strategy it is fatal, because the entire risk you are trying to measure lives in precisely the moments when real prices diverge violently from theoretical ones. A gap, a liquidity vacuum, a spread that opens to several rupees on a far strike in the last half hour of expiry — these are the events that decide a short-gamma position's outcome, and a model does not produce them. It produces a smooth curve where the market produced chaos.
Reconstructed data is recognisable by its behaviour rather than by any label on it. Real far-out-of-the-money option prices near expiry are jumpy, gappy and widely spread. If your dataset shows well-behaved curves through a violent session, you are backtesting the model that generated the data.
There is a concrete procedure for testing this on any dataset or platform in about twenty minutes, and it is already written up as part of our backtesting software guide. Run it before you pay for anything or build on anything. We would rather send you there than restate it here.
The traps — six ways an options dataset is silently wrong
None of these announce themselves. Each produces a precise, confident, incorrect answer, which is considerably more dangerous than a missing file.
1. Lot size changed, and your rupee figures did not
Lot sizes for index derivatives are revised. A rupee P&L computed by multiplying points by today's lot size across a multi-year window is simply the wrong number for every period except the current one, and the error is proportionally large.
Two correct approaches. Hold quantity in lots and convert to rupees per contract period using the lot size in force then, joined in from the contract specifications. Or restrict your sample to a single lot-size regime and state the restriction. What is not acceptable is one lot size applied across the whole window, which is the default behaviour of a surprising number of pipelines. Our page on lot size and position sizing covers why this matters for risk as well as for arithmetic.
2. Expiry weekday is per-index and it has moved
The weekly expiry weekday is not the same across indices and it has not been constant over time. The consequences in a dataset are twofold: a pipeline that infers expiry dates from a rule rather than reading them from the data will generate wrong contract identifiers, and an expiry-day strategy tested against those dates will be tested on days that were not expiry days.
The check takes two minutes and should be mandatory. Export the trade log from any expiry-day backtest and verify every trade date against the actual expiry calendar for that index in that period. It catches a startling proportion of broken runs, including in processed commercial datasets.
3. Strike ladders and intervals are not stable, which creates a survivorship problem
The set of strikes that exist for a given expiry depends on the index level and the strike interval in force, and both change over time. Two consequences.
First, a strike-selection rule expressed in absolute points ("sell 300 points away") resolves to a different moneyness at different index levels, so the rule you tested over five years was not one rule. Express selection in percentage terms or in delta terms if you want consistency across the window.
Second, and subtler: datasets frequently hold only the strikes that traded. Illiquid far strikes that existed but saw no volume may be absent entirely, which makes the ladder look tighter and more liquid in history than it was. If your rule selects far strikes, the dataset's own gaps are quietly filtering your strategy toward the strikes that happened to be active — which is a survivorship effect, and it flatters.
4. Settlement is a closing-window calculation, not the last traded price
Any rule that lets a leg run into expiry has to settle it against the correct basis. If your dataset's expiry-day row carries only a last traded price and your pipeline uses it as the settlement value, every expiry-held position is wrong by whatever the gap was — and on exactly the contracts where it matters most, since an in-the-money short option settling is the position with the largest exposure to this. The mechanism is in the closing auction session and expiry settlement.
5. Corporate actions, symbol changes and contract redefinitions
Index options are cash-settled and spared most of the corporate-action complexity that afflicts stock options, where a split or a bonus changes the strike ladder and the lot size mid-contract and requires an adjustment factor applied to history. If you move from index options to single-stock options, this becomes a first-order problem and a dataset that has not handled it is unusable rather than merely imperfect.
Even on indices, symbol conventions and contract specifications have changed over the years. A pipeline that hard-codes a naming convention will fail silently on older periods — usually by returning no rows, which looks like "no trades that day" rather than like an error.
6. Timestamp and timezone handling
Mundane and routinely broken. Timestamps may arrive in UTC or in IST, with or without timezone information, and a pipeline that assumes wrongly shifts your entire session by hours. The symptom is a backtest whose entries land outside market hours, or whose 9:20 entry is actually executing at a different point in the session. Check the first and last timestamp of any trading day in a new dataset against the actual session times before anything else. It is the cheapest check on this page and it fails more often than it should.
How to sanity-check a dataset before you trust a backtest built on it
Run this before you build. It is roughly an hour's work on a new dataset and it has saved us considerably more than that.
- Session boundaries. Pick any ordinary trading day. Confirm the first and last timestamps match the actual session times for that period. If they do not, stop — you have a timezone problem and nothing downstream is meaningful.
- Trading-day count. Count distinct trading days per month and compare against the exchange's holiday calendar. Missing days and unexpected extra days are both informative. Special sessions show up here.
- Expiry calendar. For each index in your window, verify the expiry dates present in the data against the exchange's actual calendar for that period. Do this per index — do not assume one applies to another.
- Lot size join. Confirm the lot size your pipeline applies changes at the correct dates, by checking a rupee figure on either side of a known revision against a hand calculation.
- Strike ladder completeness. On a few sample expiries, check how many strikes exist versus how many you would expect from the strike interval and index level. A thin ladder means absent strikes, and you now know your far-strike results are affected.
- The violent-day price check. Pick an expiry day where the index moved more than 1% intraday, pick a far-out-of-the-money strike and a time in the last ninety minutes, and compare the dataset's price against an independent source. Read the shape as well as the number — smoothness where there should be gaps is the tell. Full procedure in our software guide.
- Spread sanity. If the dataset carries bid and ask, plot the spread against moneyness and against time to expiry. It should widen as you move away from the money and as expiry approaches. If it does not, the quotes are modelled.
- Settlement cross-check. On a handful of expiries, compare the dataset's settlement value against the exchange's published settlement price. These should match exactly. If they do not, your pipeline is using the wrong field.
- Repeat on a second period. One clean sample can be luck, and data quality is frequently not uniform across the archive — the older end is usually worse.
Everything on that list is checkable without a view on markets, which is the point. These are the questions you can answer definitively before you start making judgement calls.
Why this matters, in one measured example
The reason to spend an hour on a dataset is that the conclusions you draw from it are only as good as it is, and the conclusions are the whole point of the exercise.
When our desk tested a widely recommended idea — take a technical indicator signal on the index and sell options against it rather than buying them — we ran it across 438 trading days. The short strangle version lost on the order of ₹499 per lot per day at zero slippage; the defined-risk version lost more rather than less; and across eighteen structure-and-parameter combinations, none passed our acceptance gate. That is a clean negative result and it was worth having.
But it is only worth having because we could stand behind the data layer underneath it. Had the prices been reconstructed, the far strikes been thin, the lot sizes been flat across the window or the expiry dates been inferred rather than read, the same run would have produced a number with no information in it — and a number with no information in it is indistinguishable, on the screen, from a real one. The fuller account of what our own record measures is in is algorithmic trading profitable — our own data.
Once the data is verified, the question becomes what to do with it, and that is a separate discipline with its own failure modes — cost modelling, sample splitting, robustness testing. We set out the full sequence in how to backtest an option-selling strategy.
A short decision guide
| If you want to… | You need | Start at |
|---|---|---|
| Study premium levels, OI build-up or term structure over years | End-of-day chain data | The exchange's own daily derivatives files |
| Backtest a fixed-time intraday option-selling rule | One-minute data with bid/ask, strikes banded around spot | A platform or vendor, with the provenance test run first |
| Backtest a strategy with intrabar stops, or study the expiry final hour | Tick or one-second data | The exchange's licensed data, or a vendor who sources it there |
| Study index direction, carry or basis | Per-expiry NIFTY futures history, rolled yourself | The exchange's historical reports |
| Verify a dataset you already have | The exchange's daily files as a reference | The nine-step check above |
| Decide which backtesting platform to buy | A feature and cost comparison, not more data | Our backtesting software guide |
Frequently Asked Questions
Where can I get NSE historical options data?
There are four distinct categories and it is worth not conflating them. The exchange's own published daily derivatives files are the free, authoritative end-of-day record, carrying open, high, low, close, settlement price, volume and open interest per contract per day — but no intraday history whatsoever. The exchange's data arm licenses historical tick and snapshot data through an application process with terms attached, and that is the primary source for anything intraday. Commercial vendors and backtesting platforms resell processed versions of the same underlying data, which is how most retail options research actually gets done. Finally, broker APIs and community datasets offer a fast low-cost start, but usually without stated provenance. We do not publish or distribute a dataset ourselves.
Is the NSE option chain on the exchange website a historical archive?
No — it is a snapshot of the present moment, carrying current prices, open interest and implied volatility. It is not a historical record, and scraping it daily to assemble your own archive is a long and fragile project that will carry a permanent gap for every day you missed, every day the page structure changed, and every day your scraper failed quietly. Several people start here and discover the limitation several months in. If you need end-of-day history, the exchange's published daily derivatives files are the right source and already contain it. If you need intraday history, no amount of processing the live chain will produce it.
What granularity of options data do I need?
Your data must be finer than your fastest rule. End-of-day data suits multi-day positional strategies and long-horizon studies of premium levels, open-interest build-up and term structure, but it cannot model a stop at all — an end-of-day backtest of a stopped strategy is a different strategy rather than an approximation of yours. One-minute data suits most intraday option-selling rules with fixed-time entries and square-offs and stops evaluated at candle close, though it approximates intrabar stops in a generally flattering direction because it smooths the worst prints inside each bar. Tick or one-second data is required for intrabar stop logic, slippage studies and the expiry final hour, and otherwise buys you only a longer run time.
What fields must historical options data contain to be usable?
The four contract keys — underlying, specific expiry date, strike and option type — plus, per timestamp, the underlying's price and the option's own price as an absolute minimum. Beyond that, three fields determine what questions you can ask. Bid and ask, without which you are implicitly assuming fills at the mid or last print and badly understating execution cost on thin strikes. Volume and open interest, without which your backtest will happily transact in strikes nobody touched. And implied volatility, needed only if your rules select by delta or reference volatility. Settlement price is essential for any rule holding into expiry. Separately, the lot size in force for that contract period usually is not in the file and has to be joined in.
What is the difference between captured and reconstructed options data?
Captured data records prices and quotes that actually occurred in the market. Reconstructed data fills gaps in illiquid contracts by pricing them theoretically from the underlying and a volatility assumption. For some research that is defensible; for backtesting a selling strategy it is fatal, because the entire risk you are measuring lives in precisely the moments when real prices diverge violently from theoretical ones — a gap, a liquidity vacuum, a spread opening to several rupees on a far strike in the last half hour of expiry. A model does not produce those; it produces a smooth curve. The tell is behavioural rather than labelled: real far out-of-the-money prices near expiry are jumpy, gappy and widely spread, so well-behaved curves through a violent session mean you are backtesting the model.
Why do my rupee backtest results look wrong on older data?
Almost always the lot size. Lot sizes for index derivatives are revised, so multiplying points by today's lot size across a multi-year window produces the wrong rupee figure for every period except the current one, and the error is proportionally large. There are two correct approaches: hold quantity in lots and convert per contract period using the lot size in force then, joined in from the contract specifications; or restrict the sample to a single lot-size regime and state the restriction explicitly. Applying one lot size across the whole window is not acceptable, and it is the default behaviour of a surprising number of pipelines, including some processed commercial ones.
How do I check that my dataset's expiry dates are correct?
Export the trade log from any expiry-day backtest and verify every trade date against the exchange's actual expiry calendar for that specific index in that specific period. Do it per index and do not assume one index's calendar applies to another. This matters because the weekly expiry weekday is not the same across indices and has not been constant over time, so a pipeline that infers expiry dates from a rule rather than reading them from the data will generate wrong contract identifiers — and an expiry-day strategy tested against those dates ends up tested on days that were not expiry days. The check takes about two minutes and catches a startling proportion of broken runs.
Is NIFTY 50 futures historical data easier to work with than options data?
Considerably, and it is often what people actually need. Futures history is one series per expiry with open, high, low, close, volume, open interest and settlement price — far smaller and cleaner than the options chain — and it exposes the basis between futures and spot, which options data does not show directly and which matters for carry and hedging studies. The trap is continuity. A continuous NIFTY futures series is a constructed object: someone chose when to roll from the near contract to the next and how to adjust for the price gap at the roll, and different conventions produce materially different series. A provider that does not state its roll convention has given you a number you cannot reproduce, so prefer per-expiry contracts and roll them yourself with the convention written down.
Can missing strikes in a dataset bias my backtest?
Yes, and it is one of the subtler problems. Datasets frequently hold only the strikes that actually traded, so illiquid far strikes that existed but saw no volume may be absent altogether. The ladder then looks tighter and more liquid in history than it really was. If your strategy selects far strikes, the dataset's own gaps are quietly steering it toward the strikes that happened to be active, which is a survivorship effect and it flatters the result. A related issue is that strike intervals and the available ladder change with index level and over time, so a selection rule expressed in absolute points resolves to different moneyness at different index levels — express it in percentage or delta terms if you want one consistent rule across the window.
How long does it take to validate a new options dataset?
About an hour, and it is the best-spent hour in the whole project. Confirm the first and last timestamps of an ordinary day match the real session times, which catches timezone errors that would otherwise shift your entire session. Count distinct trading days per month against the holiday calendar. Verify expiry dates per index against the exchange's calendar. Check that the lot size your pipeline applies changes at the correct dates. Check strike ladder completeness on a few expiries. Compare a far strike's price on a violent expiry day against an independent source, reading the shape as well as the number. Plot the bid-ask spread against moneyness and time to expiry and confirm it widens where it should. Cross-check settlement values against the exchange's published figures. Then repeat on an older period, because data quality is rarely uniform across an archive.
Does EliteAlgo provide a historical options dataset?
No. We do not publish, sell or distribute a historical options dataset, and this page is a practitioner's guide rather than a data offering. Our desk maintains data for its own research, and what we publish from that is measured results rather than the underlying files. For the data itself, the exchange's own published daily files are the free authoritative end-of-day source, the exchange's data arm licenses intraday history under its own terms, and commercial vendors and backtesting platforms resell processed versions. Where we can help is in the two layers around the data: deciding which platform suits what you are doing, and running the research method correctly once you have the data in hand.
What should I do after I have verified my data?
Verified data removes one class of failure and leaves the others untouched, so the next discipline is the research method itself. In order: specify your rules until no judgement remains at execution time; build the full cost stack, with slippage modelled per leg and stop exits penalised harder than planned exits, because an option-selling result at thin costs can be the opposite sign to the same result at honest ones; split the sample by contiguous time before looking at any output, with both halves spanning several volatility regimes; read the result as a distribution rather than a total; and then try to break it by perturbing every parameter and recording how many configurations you tested. Data quality and method quality are separate problems, and a clean dataset does not protect you from a fitted result.
The Bottom Line
Historical options data for Indian index options is a four-key object — underlying, expiry date, strike and option type — and what you can do with it depends on which fields come attached. Without bid and ask you cannot model execution; without volume and open interest you cannot tell whether the strike was tradeable; without settlement prices your expiry-held positions are wrong. Choose granularity by the question: end of day for positional and long-horizon work, one minute for fixed-time intraday rules, tick for intrabar stops and the expiry final hour. The exchange's own daily files are the free, authoritative end-of-day reference and carry no intraday history at all; intraday data comes from the exchange's licensed feed or from vendors and platforms that have processed it. Before any of that, settle the provenance question — captured from real trades, or reconstructed from a model — because a reconstruction is smooth exactly where the risk is. Then run the checks: session boundaries, trading-day count, expiry calendar per index, lot size joined at the correct dates, strike ladder completeness, far-strike behaviour on a violent day, spread against moneyness, and settlement values against the exchange's published figures. An hour of that work is the difference between a backtest result and a number that merely looks like one.
This article is for educational and informational purposes only and does not constitute investment advice. EliteAlgo is proprietary trading research and analytical software; it is not a SEBI-registered investment adviser and does not provide investment advice, strike or strategy recommendations, or trading tips. EliteAlgo does not publish, sell or distribute a historical options dataset, and nothing above constitutes an offer of data, a data product or a data service. No vendor, platform, data source or strategy mentioned or implied above is recommended. Exchange file formats, archive depths, download locations, licensing terms, contract specifications, lot sizes, strike intervals, expiry calendars and settlement procedures are set by the exchanges and SEBI and are revised from time to time — take all current details from the exchange's own published sources before relying on them. Backtested and logged results described above are what our own data did over specific samples; they do not guarantee future outcomes and imply no expected return. Paper trade before deploying live capital and consult a SEBI-registered investment advisor before trading derivatives.