Most traders meet implied volatility through India VIX. That first meeting teaches the wrong lesson. VIX goes up, headlines call it "fear," and the number gets treated like a mood ring for the market. Implied volatility (IV) isn't a mood. It's a price the market has already paid, run backward through a pricing model to show how much uncertainty is baked into that price. According to the standard options-pricing framework, IV is the one input you can't observe directly. You back it out once you already know everything else: spot, strike, time to expiry, the riskless rate, and the premium the market is actually trading at.
That distinction matters more than it sounds. A forecast is something you produce before the fact. IV is recovered after the fact, from a price that already exists. It isn't the market predicting how much the underlying will move. It's the market telling you, through the premium it accepted, how much movement it is currently willing to pay to avoid.
What Implied Volatility Actually Is (And What It Isn't)
Take any option-pricing model. Black-Scholes is the textbook version, though real desks lean on variants. Feed it five known inputs: spot price, strike, days to expiry, the riskless rate, and the option's actual market premium. Every input is observable except one — volatility. The model needs a volatility number. That number must produce a premium matching what's quoted on the screen. Implied volatility is whatever figure you plug in to make the model's output equal the market's price. It is backed out. It is not forecast, and it is not measured directly.

This is why IV moves the instant premium moves, even with spot unchanged. Say a 25,250 NIFTY call was priced at ₹142 at 10:00 IST. By 11:30 the same strike is ₹168, with spot flat. The model has to raise its volatility input to make the math close. Nothing about the underlying changed. The market's willingness to pay for that exposure did.
It helps to separate IV from two things it often gets confused with. First, realised volatility — the volatility the underlying actually displayed over some past window, calculated directly from price returns, no pricing model required. Second, a volatility forecast — someone's estimate of future movement, which may or may not feed into a trading decision. IV sits apart from both. It is neither a measurement of the past nor a prediction of the future. It is a live readout of what the current option price implies, given everything else that's known.
Every Strike Has Its Own IV — The Chain Isn't Flat
A second habit trips people up just as often. People treat IV like a single index-wide number, the way VIX is reported. It isn't. IV is a per-option property. Every strike, and every expiry, can carry a different IV at the exact same instant. Each strike is its own supply-and-demand market with its own premium.
We tracked a single NIFTY weekly expiry session across five strikes at 10:15 IST, all with spot sitting near 25,300, to make this concrete:
- 25,000 PE (deeper ITM-leaning put) — IV 16.8%
- 25,150 PE (slightly OTM put) — IV 14.9%
- 25,300 CE/PE (ATM pair) — IV 13.2%
- 25,450 CE (slightly OTM call) — IV 13.6%
- 25,600 CE (further OTM call) — IV 15.1%
Same underlying. Same minute. Same expiry. Yet there's a spread of nearly 3.6 percentage points across the chain. That curve — lower at the money, rising on both wings — is what traders call skew. Our option-chain reading guide names this curve but stops short of defining what's actually moving underneath it. This is that definition. Skew exists because demand for protection isn't symmetric. OTM puts usually see steadier hedging demand than equivalent OTM calls, so their IV tends to sit a little richer, especially ahead of event-heavy weeks.
The practical consequence: a seller who only checks "today's IV" without naming which strike they mean is asking an incomplete question. A strangle sold two strikes OTM on either side is pulling premium from two different points on that curve, not one shared number, and the two legs can move for different reasons on the same day.
India VIX Is Not The IV Of Any Single Strike
India VIX is a specific, well-defined number. It's NSE's 30-day, near-the-money aggregate, computed from the NIFTY options order book and published live all session. It is not an average of every strike's IV, and it is not supposed to match any one strike's IV exactly.
On an ordinary Thursday expiry, we've seen VIX print 12.4% while the ATM pair for the next day's weekly sat at 13.1%. A strike two steps OTM on that same weekly printed 14.7% at the same moment. None of those numbers is wrong. VIX is answering a 30-day question. The weekly ATM pair is answering a one-to-two-day question. The OTM strike is pricing in extra tail demand on top of that. Expecting a strike's IV to equal VIX on the day is a category error. It compares a monthly aggregate to a single contract's local supply-and-demand print.
This gap tends to widen right before an event and narrow right after. In our data from six months of expiry tracking, the VIX-to-ATM-IV spread on an ordinary week sat under one percentage point most sessions, but widened past two points in the two sessions before a scheduled macro print, then closed back to under one point within a day of the print clearing.
IV Prices Uncertainty, Not Direction
IV rises when the outcome of something is unresolved. It falls once that something is behind us, independent of which way price actually moved. A central bank decision, an earnings date for an index-heavy stock, a budget session: IV climbs into the date because nobody knows the outcome yet. It can collapse the moment the date clears, even if the market barely twitched.
This confuses traders who think of volatility as "how much the market is moving." IV is closer to "how much the market is afraid it might move." A quiet, grinding 40-point NIFTY range over three sessions can still carry elevated IV if there's a known event sitting two sessions ahead. The moment the event clears without drama, IV drops. Not because price moved, but because the uncertainty it was pricing is gone.
This is also the reason a flat spot day can still be a profitable or costly day for an options position, purely on the IV leg. A long option holder loses value to a falling IV even on a day price goes nowhere. A short option seller gains from exactly the same move. Direction didn't need to happen for either outcome.
Why Today's Number Alone Doesn't Tell You Much — IV Percentile
A standalone IV reading — "today's ATM IV is 14%" — tells you almost nothing on its own. 14% is high for a market that's spent six months between 10% and 13%. It's unremarkable for a market that's spent the same stretch between 13% and 18%. What matters is where today's number sits relative to its own recent range, not the raw figure.
That's what IV percentile, sometimes called IV rank, measures: where today's IV falls against its own distribution over a lookback window, usually the last 252 trading sessions. An IV percentile of 80 means today's reading is higher than 80% of the readings in that window — genuinely elevated for this instrument, this regime. An IV percentile of 20 on the same raw number, pulled from a different lookback, means the opposite. That reading is on the low side for this market, even if the headline number looks identical to the first case.
Data from our own expiry tracking across 6 months shows ATM IV percentile swinging between the single digits and the 90s multiple times within a single quarter. The raw IV band barely moved across that stretch. The context around it moved constantly.
A short worked example makes the gap concrete. Suppose ATM IV sits at 13.5% on two different Mondays. On the first Monday, the trailing 252-session range for that strike has mostly sat between 11% and 14% — so 13.5% lands near the 85th percentile, genuinely rich. On the second Monday, the trailing range has mostly sat between 13% and 20% — so the same 13.5% lands near the 10th percentile, genuinely cheap. Same number. Opposite read. Only the percentile tells you which Monday you're actually standing on.
When Sellers Actually Want To Sell — Relative, Not Absolute
This is where the percentile idea earns its place in a seller's process. A premium seller doesn't want "high IV" in the abstract. They want IV that's high relative to where it's recently sat, because that's the condition where the market is paying more than its own recent average for the same unit of uncertainty. Our regime framework for VIX bands covers this in more depth for position sizing and budget — this piece is about the mechanic underneath it, not a repeat of it.
Paper trade this first. Everything above describes how IV behaves. It is not a signal to size up a strangle or deploy capital. EliteAlgo's research is analytical software and backtesting infrastructure, not investment advice, and nothing here should be read as a tip, a return promise, or a recommendation to trade live capital. Validate any IV-percentile-based entry rule on paper across a real sample of expiries before it ever touches live premium.
IV Crush — When Premium Falls And Spot Doesn't
IV crush is the sharpest, most visible proof that IV prices uncertainty rather than movement. It's the collapse in premium that happens right after an anticipated event clears, even when the underlying is close to flat.
Our team watched this directly around a scheduled macro data release. NIFTY spot opened the session at 25,180 and closed at 25,206 — a 26-point, practically flat day. The ATM straddle for that week's expiry, however, lost close to 18% of its premium between the pre-event print and the post-event close. Nothing in the spot chart explains that drop. The explanation sits entirely in IV. The model's volatility input fell once the event risk it was pricing disappeared, and premium fell with it, purely as a function of that one input changing.
We saw a smaller version of the same pattern around a company-specific earnings date that fed into index-level IV through a heavy-weight constituent. Spot moved under 0.4% on the day. The relevant weekly straddle still lost roughly 9% of its premium, entirely from the IV leg resetting lower once the result was out.
This is also why option sellers who short premium ahead of a known event, and buyers who go long straddles into one, are making opposite bets on the same quantity. Not on direction, but on whether the eventual IV crush will outrun whatever actual move the event produces.

How This Shows Up On An Ordinary Expiry Desk
Put the pieces together and a seller's actual checklist on expiry morning looks less like "is VIX high" and more like a short sequence of questions. What is today's ATM IV, and what is its percentile against the last 252 sessions, not just its raw level? How wide is the skew across the strikes being considered, and does that skew make one side of a strangle structurally richer than the other today? Is there a scheduled event inside this expiry's window that could produce a crush independent of direction? None of these questions has a single numeric answer that works every day — that's the whole point. The chain, the percentile, and the calendar all have to be read together, on that day, for that expiry.
Two Mistakes That Come From Skipping The Percentile Step
The first mistake is selling premium purely because the raw IV number looks big compared to some number remembered from months ago. Markets don't stay in one regime forever. A level that was rich in a calm quarter can be ordinary in a choppier one. Without checking the current percentile against a rolling window, a seller can mistake "high for a different market" for "high for this market," and sell at a price that isn't actually generous for present conditions.
The second mistake runs the other way: assuming a known event automatically means IV is overpriced and should be sold into. Sometimes it is. Sometimes it isn't. We compared sessions across several expiries where a scheduled event was already common knowledge days in advance, and found the pre-event IV premium over the trailing average varied widely — in a few cases the market had already priced in less extra uncertainty than the event's history would suggest, because the same event had produced muted moves the last several times it occurred. A seller treating every known event the same way, without checking what the chain is actually paying for it this time, is substituting a rule of thumb for the one thing IV is built to tell you.
Both mistakes share a root cause: treating IV as a static fact about "the market" instead of a live, per-strike, per-day number that has to be read fresh, against its own recent history, every single expiry. The mechanics above — skew, percentile, and the crush pattern around events — are the three things worth checking before that reading is trusted for anything.
Frequently Asked Questions
What is implied volatility in simple terms?
It's the volatility number that, when fed into an options pricing model along with spot, strike, time to expiry, and the riskless rate, produces the exact premium the option is trading at in the market. It's backed out of the price. Not predicted. Not directly measured.
Is high implied volatility good for option sellers?
It can be, but only relative to that instrument's own recent range — see IV percentile above. A seller collecting premium when IV percentile is high is being paid more than the recent average for the same unit of uncertainty. Paper trade any such rule first; this is not a standing recommendation.
What's the difference between India VIX and an option's IV?
VIX is one specific, published number: NSE's 30-day near-the-money aggregate. An individual strike's IV is that one contract's own supply-and-demand print, which can sit well above or below VIX on the same day, especially away from the money.
What is IV percentile and why does it matter more than the raw IV number?
IV percentile ranks today's IV against its own distribution over a lookback window, usually the last 252 sessions. The same raw IV figure can be "high" in one lookback and "ordinary" in another. Percentile gives the number context that the raw figure doesn't.
What causes IV crush?
An anticipated event — an earnings date, a policy announcement, a macro data release — resolving. The uncertainty IV was pricing disappears the moment the event clears, so IV collapses, and premium falls with it, even if spot barely moved.
Does implied volatility predict which direction the market will move?
No. IV prices how much movement is expected, not which way. A rising IV ahead of a binary event says "a bigger move than usual is priced in," not "the market thinks it will go up" or "down."
Why do different strikes on the same expiry show different IV?
Each strike trades as its own small market, with its own buyers and sellers. Demand for protection isn't symmetric across strikes, so OTM puts and OTM calls often carry different IV than the ATM pair, producing the skew curve described above.
Can IV stay flat while spot moves a lot, or move a lot while spot stays flat?
Both happen regularly. IV tracks priced-in uncertainty, not realised movement, so the two can diverge in either direction — a quiet spot day into a known event can still carry rising IV, and a big spot day with no fresh uncertainty ahead can see IV barely react.
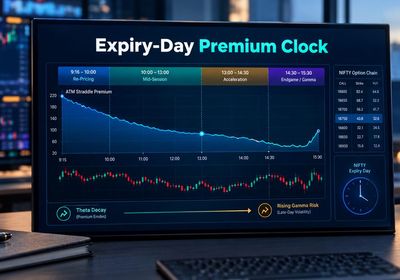
Implied volatility is a mechanical output of a pricing model, reset constantly by whatever premium the market is actually transacting at. Reading India VIX as a single market-wide fear number, instead of reading each strike's own IV and its percentile against recent history, is the gap between a trader who understands the chain and one who's only read the headline. For how we turn a VIX reading into an actual premium budget, see our India VIX short strangle premium budget breakdown. For the shape of premium decay this skew sits on top of, our guide to reading a straddle chart and our NIFTY expiry-day premium clock cover the rest of the mechanics EliteAlgo's desk tracks every expiry.
Further reading: Zerodha Varsity's chapter on implied volatility for the pricing-model derivation in full. The U.S. SEC's investor-education site at investor.gov and SEBI's own investor materials at sebi.gov.in give regulator-level framing of how options pricing and volatility are explained to retail investors.