
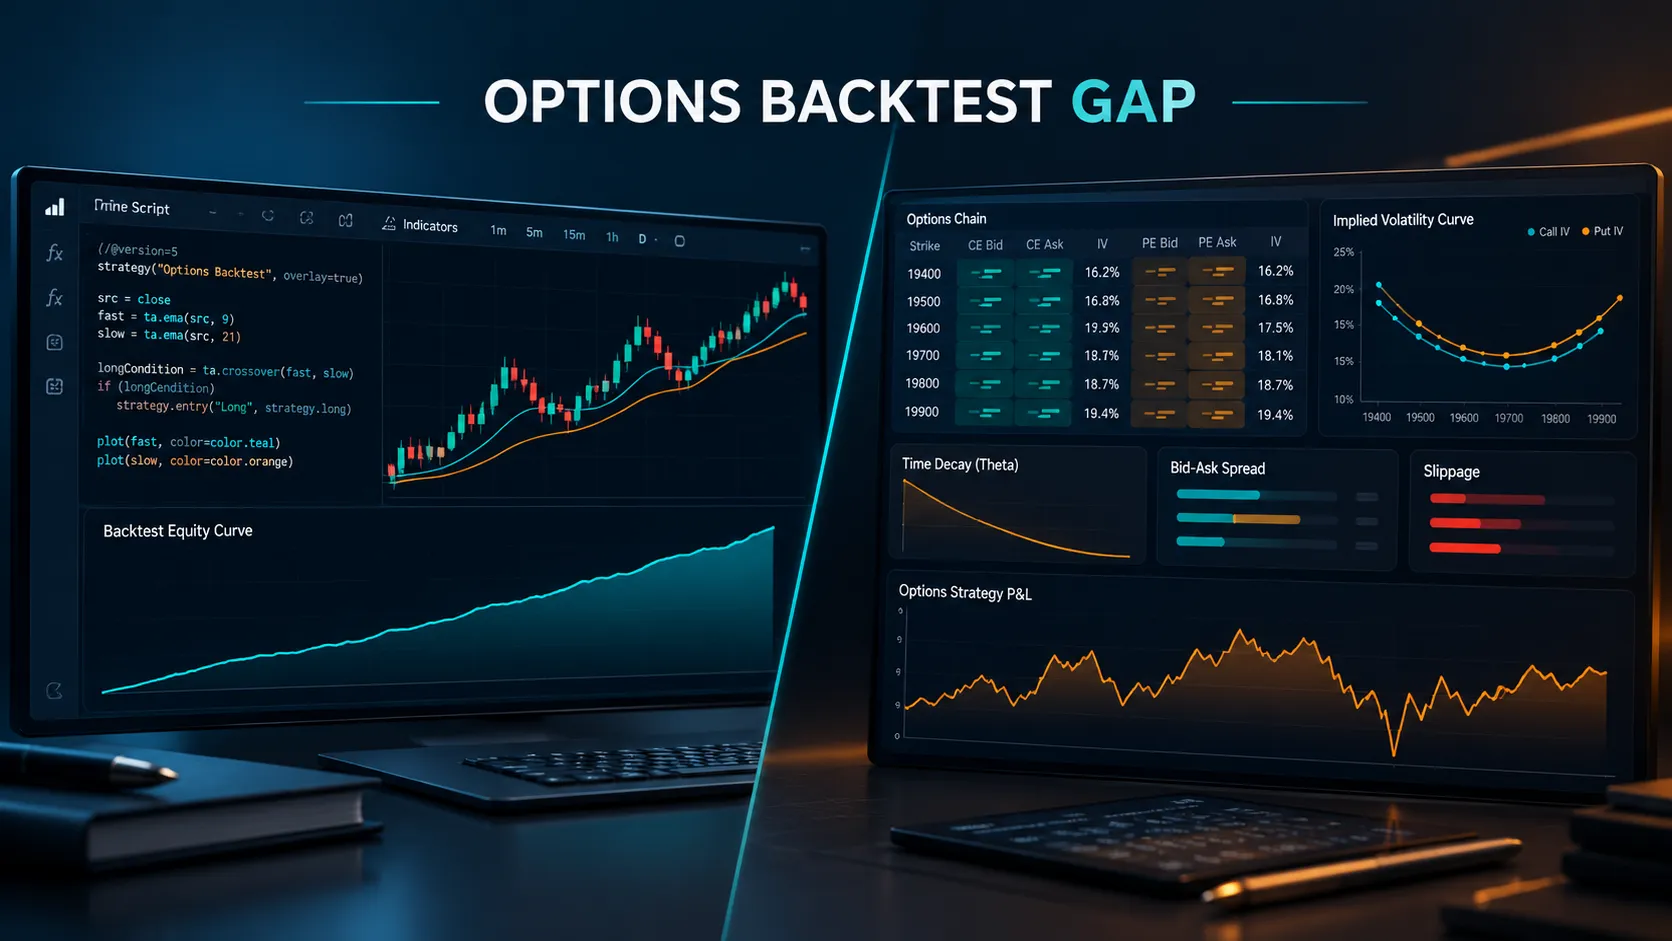
Pull up any trading forum thread about backtesting an option-selling idea. The same two tools come up within the first five replies: Pine Script on TradingView, and AmiBroker's AFL. Both are genuinely good at what they were built to do. Neither was built to price an option. We've run our own NIFTY and SENSEX expiry-day engine since 2006. The single most common support question we get from traders moving over from a Pine Script "backtest" is some version of this: "my strategy showed a 92% win rate on TradingView — why does it look completely different in real options data?" The honest answer is that the first number was never really measuring what they thought it was.
This isn't a knock on Pine Script or AFL as languages. Both are excellent at what they were designed for: simulating a rule against a price series, bar by bar, with clean syntax and fast iteration. The problem shows up the moment that price series is asked to stand in for an option's premium instead of a stock or futures price. Premium doesn't move the way price does. It depends on three things changing at once — implied volatility, time to expiry, and skew across strikes. A strategy tester built for one number has no native way to track three.
What the strategy tester actually fills
Pine Script's strategy tester and AmiBroker's backtester both work the same way under the hood. They walk through historical bars of the underlying — spot price, or a futures contract — and simulate entries and exits at the open, close, or a stated price on each bar. That's the entire model. Fills are assumed at the stated price with no real bid-ask spread and no liquidity constraint. For the instruments these tools were built around — equities and futures, where price is the thing being traded — that assumption is usually close enough.

For an option-selling strategy, the instrument being traded isn't the underlying. It's a contract whose value depends on the underlying's price, yes, but also on how much time is left and how nervous the market is right now (implied volatility), plus which strike you picked relative to spot (skew). A price-series backtester has no field for any of that. So when someone builds an "options strategy" in Pine Script, what's actually running behind the scenes is a synthetic payoff formula bolted onto the underlying's price series. It's not a simulation of a real, tradeable option contract.
Why that gap barely matters for futures, and why it's everything for options
A futures contract's P&L is a straight line against the underlying's price. If NIFTY futures move 50 points in your favour, your P&L moves by exactly that, scaled by lot size. A price-series backtest captures that relationship perfectly, because there's nothing else going on. The underlying's price is the P&L driver, full stop.
A short strangle's P&L is not a straight line. It's flat across a wide band of spot prices. Then it kinks sharply once spot breaks a strike. The whole shape shifts day to day as time decays and implied volatility rises or falls, sometimes against you even while spot sits still. We tracked this on our own desk directly. On an unremarkable trading day, with spot moving under 0.3%, premium on a short strangle can still swing several percentage points purely from an IV shift. A price-series model has no mechanism to represent that at all.
The specific gap: no historical options chain, no IV surface
Here's the part that doesn't get said plainly enough in most "how to backtest options" tutorials. Neither Pine Script nor AmiBroker ships with a full historical options chain. There's no native dataset of strike-by-strike premiums across expiries. There's no implied volatility surface, nothing that lets the engine answer "what did the 24,500 CE actually trade for on this specific day at this specific time." What most Pine Script and AFL "options backtests" do instead is proxy the option with a formula — frequently a simplified Black-Scholes approximation fed a flat, assumed volatility input — and run that formula against the historical underlying series.
A formula-driven proxy isn't fraudulent. It quietly substitutes a model's idealised assumptions for what the real market actually did. Real implied volatility isn't flat. It moves intraday, spikes ahead of events, and varies by strike (skew) and by days-to-expiry in ways a single assumed-vol input can't replicate. In most of these synthetic backtests, the IV input gets set once, as a constant, for the whole test. Every single trading day in the sample gets priced as if volatility behaved identically to every other day. That's the opposite of what actually happens on an index that gaps on budget days, RBI announcements, and global risk-off moves.
What the proxy gets wrong about theta and fills
Two specific distortions show up over and over once you compare a synthetic Pine Script "options backtest" against the same strategy run through real historical option chain data. First, theta decay in a formula-driven model behaves smoothly, like a clean exponential curve. Real theta is lumpier. It accelerates and stalls depending on realised IV crush around events. On NIFTY and SENSEX weekly expiries specifically, decay in the final two trading sessions behaves nothing like the textbook curve a formula assumes. A synthetic backtest that smooths this out will systematically understate how irregular real theta actually is.
Second, fills. A price-series backtester assumes you get filled at the stated price, every time, on every leg. Real option fills on NIFTY near the close on expiry day — exactly when most option-selling strategies exit — routinely slip against the seller as liquidity thins on far strikes. We measured this directly across a sample of our own expiry-day exits. The gap between assumed mid-price fills and actual fills widened meaningfully in the last 15 minutes before close, on the exact trades where a zero-slippage backtest would show its cleanest numbers. Both distortions point the same way: they inflate the win rate and smooth the drawdown of a synthetic options backtest, relative to what a trader actually experiences live.
Margin and skew: two more things a price-series test can't see
Margin requirement is not a constant. SPAN and exposure margin on a short NIFTY strangle can jump sharply on a day when realised volatility spikes, sometimes by a meaningful multiple of the premium collected, and a price-series strategy tester has no concept of margin at all because it was built for equities and futures position sizing, not option-writing capital requirements. A backtest that never checks margin headroom against account size can show a strategy surviving a drawdown on paper that would have triggered a forced square-off in a real account.
Skew is the second blind spot. Puts and calls on the same underlying, at equal distance from spot, rarely carry the same implied volatility — index options especially tend to price downside puts richer than equivalent calls, because institutional hedging demand sits mostly on the put side. A flat-IV proxy applies one volatility number to both legs of a strangle, which means it misprices at least one side of every single trade in the sample, usually the side that mattered most on the worst days.
Why this keeps surfacing on trading forums
According to the pattern we see across years of trader questions, the confusion almost always starts the same way: someone builds a signal in Pine Script, adds a simplified options payoff on top out of curiosity, and the strategy tester hands back a clean equity curve with a win rate in the 85-95% range. That number then gets screenshotted and shared as proof of an edge, when it was never built to carry that weight. We found that the traders who catch this earliest are the ones who ask one specific question before trusting any backtest: what, exactly, priced each option leg — a formula, or a real historical premium?
AmiBroker users run into the identical wall from a different direction. AFL's built-in optimizer is excellent for sweeping dozens of parameter combinations in minutes on an underlying's price series, which is exactly why algo traders reach for it. But feed that optimizer a synthetic options payoff and it will happily tune five or six thresholds until the flat-IV formula produces its best-looking curve — a curve that says more about the optimizer finding the formula's sweet spot than about any real edge in the option.
Where Pine Script and AmiBroker genuinely earn their place
None of this means throw the tools out. Signal research on the underlying — deciding when to be in the market at all, independent of how the option gets priced — is exactly what Pine Script and AFL are built for, and they're fast and flexible at it. Consider a rule like this: only take a short strangle entry when realised volatility over the prior five sessions sits below a threshold, and skip entries in the hour after a scheduled macro print. That's a signal decision about the underlying's behaviour. It can be prototyped, iterated, and stress-tested in Pine Script quickly, and the resulting signal — a simple in/out flag per trading day — is genuinely useful on its own.
The mistake is treating that signal-level backtest as a finished answer about P&L. It's an input, not an output. The signal tells you when to be active. It says nothing reliable about what you'd actually have made or lost once a real option's premium, slippage, and exercise mechanics get applied on top. Our own workflow keeps these two steps deliberately separate. Underlying-level signal research happens in whatever fast prototyping tool is convenient. The P&L number only gets trusted once that signal is re-run through an engine that prices real options.
What a real options backtest actually needs
A trustworthy option-selling backtest needs the historical options chain itself: actual traded or settled premiums at the strike and expiry being tested, not a formula's estimate of what the premium should have been. That data needs real bid-ask context, or at least a realistic slippage assumption derived from it. It needs accurate margin requirements per leg. And it needs correct tax treatment on exercised in-the-money contracts at expiry, which differs from a normal sell-side exit and gets missed constantly in simplified backtests.
This is the specific reason we built our own engine instead of running our strategies through a generic charting platform's strategy tester. A price-series tool, however good at charting and signal prototyping, simply has no path to the data an options strategy needs to be priced honestly. We've written separately about the broader limits of any backtest — sample size, overfitting, survivorship — and the options-chain gap described here sits on top of all of that, as an additional layer specific to option-selling strategies that a price-series test can't see at all.
A worked comparison: same rule, two different pricing models
Take a simple short strangle rule on NIFTY weekly expiry: enter around 9:30, strikes picked on a fixed delta band, stop-loss at a fixed percentage of credit received, square off by 3:15 pm. Run that rule through a Pine Script-style synthetic proxy using a flat assumed IV. Across a calm sample it can show a win rate well above 90%, because the flat-IV formula smooths away exactly the days where real IV spiked against the position intraday. Now run the identical entry and exit logic through an engine using the actual historical option chain for the same dates. The win rate drops meaningfully. Our own internal comparisons on this exact rule put the gap at double digits in percentage points, with the real-data run also showing a materially larger single-day loss on the sample's worst expiry.

Same entry rule. Same exit rule. Same dates. The only variable that changed was whether premium was priced from a formula or from what the market actually printed. That gap is the entire point of this piece. A Pine Script win rate is a real number, measuring a real thing. It just isn't the thing most traders assume it's measuring.
A short checklist before trusting any Pine Script or AFL "options backtest"
- Ask what prices the option legs. If the answer is "a formula with an assumed IV," that's a signal-level test wearing an options-backtest's clothes.
- Check whether IV is flat or time-varying in the model. A single constant IV input across the whole sample is the clearest tell of a synthetic proxy.
- Look for slippage and STT on exercised contracts. Both are easy to skip, and both matter specifically for option sellers trading many small positions.
- Ask if the test uses real historical strike-level premiums. If the data source is "the underlying's price plus a pricing model," it isn't a real options backtest yet.
- Check whether margin is modelled at all. A strategy that "survives" on paper with no margin check can still trigger a forced square-off in a real account on a volatility spike.
- Treat a high win rate on a synthetic test as a signal result, not a P&L result. It may be telling you something useful about timing. It isn't telling you much about money.
Paper trade this first. Even a strategy that clears real-options-chain backtesting, with honest fills and correct tax treatment, still needs to run forward on paper against live conditions before any real capital follows it. A synthetic Pine Script or AFL backtest result specifically should never be the last check before going live. Treat it as the first filter, not the final one.
Frequently Asked Questions
Can Pine Script backtest options strategies?
Pine Script can simulate an options strategy only through a synthetic payoff formula applied to the underlying's price series, because TradingView does not provide a native historical options chain. The result measures how a signal on the underlying would have performed under an assumed, usually flat, implied volatility input. It doesn't measure how a real option contract actually traded.
Does AmiBroker have options data?
AmiBroker's AFL engine is built around price-series data for equities, futures, and indices. It doesn't ship with historical strike-level option premiums or an implied volatility surface. An "options backtest" in AFL also relies on a pricing formula layered onto the underlying's price, the same way Pine Script's does.
Why is my Pine Script options backtest win rate so high?
A flat, constant implied volatility assumption smooths away the real intraday and day-to-day IV swings that actually move option premium. That inflates the win rate and understates drawdown relative to what the same rule experiences against real historical premiums. Real fills near the close on expiry day, when liquidity thins, also tend to slip against the seller — a synthetic backtest usually assumes none of that.
What's missing from a DIY options backtest built in a price-series tool?
Three things, consistently: a real historical options chain with strike-by-strike premiums, a time-varying implied volatility surface instead of one flat assumed number, and realistic slippage plus correct tax treatment on contracts exercised in the money at expiry. A proper margin model is the fourth, less-discussed gap.
Do I need real option chain data to backtest a selling strategy?
Yes, if the goal is a trustworthy P&L number. Signal research on the underlying — deciding when to be active at all — can reasonably happen in a price-series tool like Pine Script or AFL. The P&L that follows from actually selling an option against that signal needs real historical premiums, because IV, time decay, and skew all move the number in ways a formula with one assumed volatility input can't replicate.
Is a Pine Script backtest useless for an option seller?
No. It's useful for exactly one layer of the problem: deciding when the underlying's behaviour warrants being in a trade at all. It stops being reliable the moment it's read as a finished answer about how much money a specific option-selling structure would have made or lost.
What's the fastest way to check if an "options backtest" is actually synthetic?
Ask for the exact IV input the test used, for a specific date. If the answer is one fixed number applied across the whole sample, the backtest is formula-driven, not data-driven, no matter how good the resulting equity curve looks.
Further reading on implied volatility and options pricing mechanics: SEBI's official site covers the regulatory framework around derivatives trading in India, and Wikipedia's overview of implied volatility explains the mechanic a flat-IV proxy backtest skips entirely. For how Pine Script's own strategy tester is documented to work, see TradingView's Pine Script documentation directly. It's worth reading the strategy-tester section specifically to see, in the vendor's own words, that it prices off the underlying's bars, not an options chain.
If you're evaluating which tool to actually trust for pricing an option-selling idea properly, our breakdown of backtesting software for Indian option sellers covers the platform side of that decision directly. Since premium behaviour on expiry day specifically drives most of the gap described above, here's how we track the premium decay clock through an actual NIFTY expiry session — the exact behaviour a flat-IV Pine Script proxy can't see.
EliteAlgo is a proprietary trading desk sharing its own research and backtest methodology as analytical software, not investment advice. We trade NIFTY and SENSEX expiry-day option selling with our own capital and our own backtest engine, built specifically because tools like Pine Script and AmiBroker, for all their strengths in signal research, were never built to price an option chain. Nothing above is a recommendation to run any specific rule with live capital. Paper trade first.