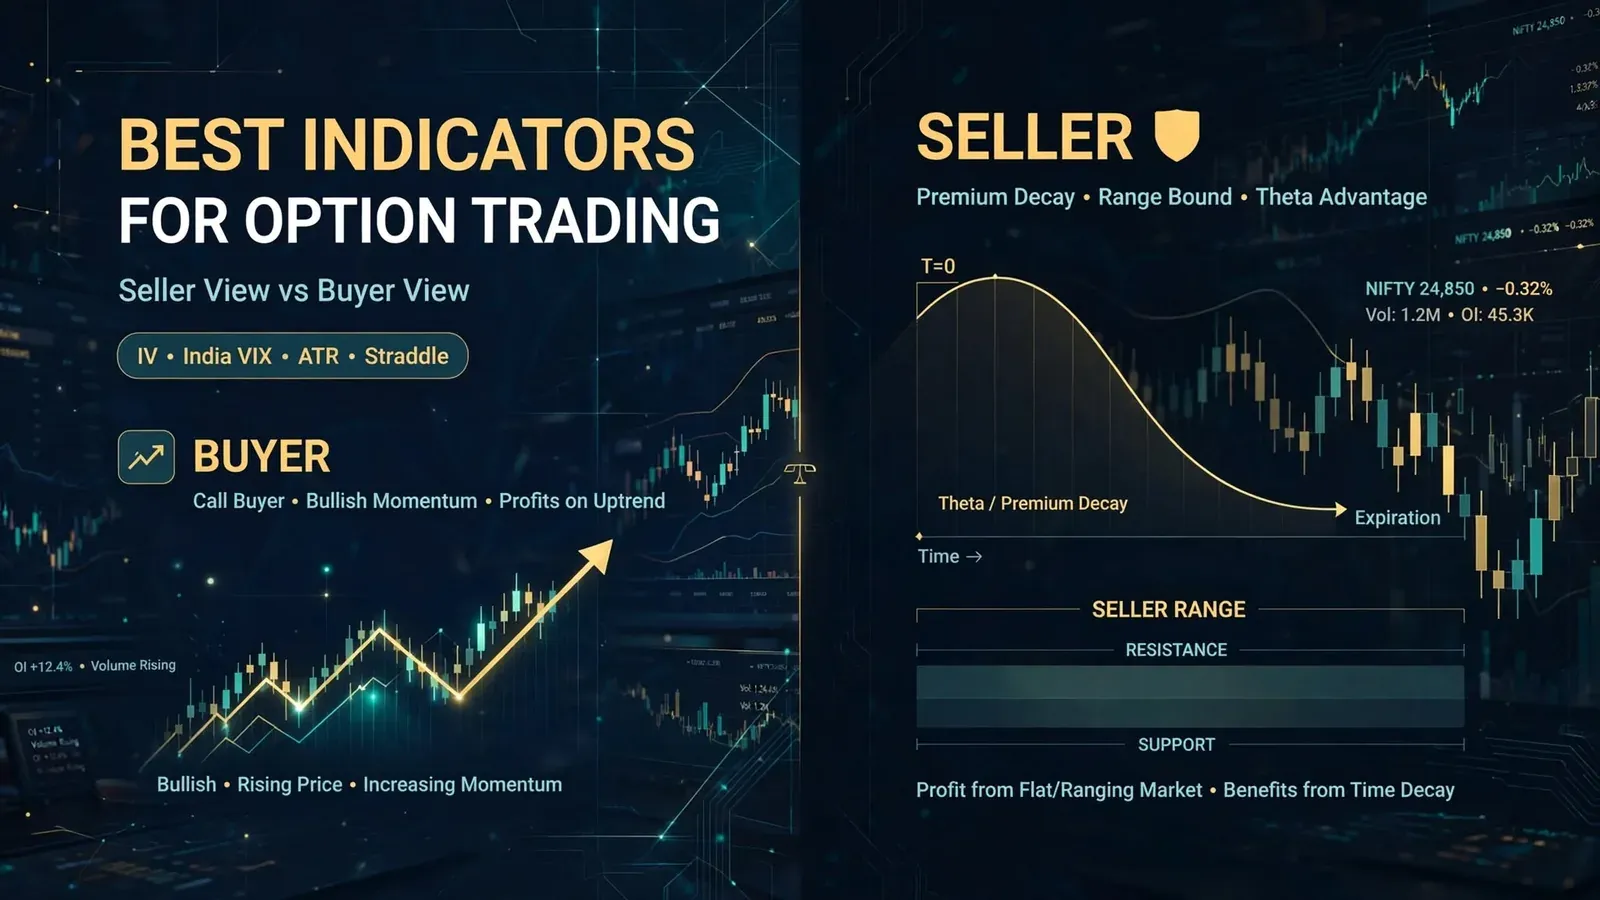
Search for the best indicator for option trading and you get the same list every time: RSI, MACD, Supertrend, Bollinger Bands, moving averages. Those are fine tools. But almost every one of them answers a single question: where is price going next? That is the question an option buyer has to get right. An option seller is asking something else. How much is the market paying me to take this risk, how far can price travel before I'm hurt, and how much time is left on the clock?
So the honest answer is that there is no single best indicator. There is a best set for buyers and a different set for sellers, and the second set rarely shows up in the top results. This guide splits the list in two, explains what each tool actually measures, and shows how a rule-based system can combine a few of them without curve-fitting. One thing up front: no indicator is a buy or sell signal on its own. Every figure below is an illustrative example chosen to keep the arithmetic easy. None of them is a level to trade.
Why most indicator lists are written for option buyers
Read the pages that rank for this keyword and look at what they share. The 5paisa guide to indicators for options trading and the Ventura Securities list of popular options indicators both lead with momentum and trend tools. Implied volatility gets a paragraph near the end, if it appears at all. Time decay is mentioned as a Greek, not as something you plan a trade around.

That order makes sense if you assume every reader buys calls and puts. A buyer pays premium up front and loses it slowly as the clock runs. To make money, the buyer needs a move, in the right direction, quickly enough to beat decay. Direction and timing are everything, so direction tools sit at the top of the list.
A seller has the opposite problem. The seller collects premium on day one and keeps it if price stays inside a range until expiry. Direction still matters, but only at the edges. A NIFTY short strangle with strikes 300 points either side of spot doesn't care whether the index ends 50 points up or 50 points down. It cares whether the index travels 300 points, and how fast. That's a volatility question and a time question, which is why a seller's dashboard looks so different.
Most of the traffic for this keyword in India comes from people trading NIFTY and SENSEX weekly options. In our experience, a large share of them either sell premium already or want to. Giving them a buyer's checklist is like handing a bowler a batting coach's notes.
Direction tools: RSI, MACD, Supertrend and what they really tell you
Direction tools aren't useless for sellers. They're just answering a narrower question than most people think. Here's what each one measures, in plain terms.
RSI
The Relative Strength Index compares the size of recent up-closes with recent down-closes and scales the result from 0 to 100. J. Welles Wilder introduced it in his 1978 book on technical trading systems, with a default lookback of 14 periods, and the Wikipedia entry on the Relative Strength Index lays out the formula. Readings above 70 are labelled overbought and below 30 oversold.
What RSI really tells you is how one-sided the last 14 bars have been. It doesn't tell you a reversal is coming. In a strong trend, RSI can sit above 70 for days. For a seller, a very high or very low RSI is a warning that the market is moving in one direction with some force. That's a reason to be careful about the strike on the side price is heading towards, not a reason to sell the other side.
MACD
MACD is the gap between a 12-period and a 26-period exponential moving average, with a 9-period average of that gap as the signal line. It shows whether short-term momentum is pulling away from longer-term momentum. It lags by construction, because it is built from averages. On a 5-minute NIFTY chart, a MACD crossover often prints after a good part of the move has already happened.
Supertrend
Supertrend draws a line a fixed multiple of ATR above or below price and flips when price closes through it. A common setting is a 10-period ATR with a multiplier of 3. It's popular because it gives a clean "trend up / trend down" state. The cost is whipsaw. In a sideways session, which is exactly the session a seller hopes for, Supertrend can flip four or five times before 15:00 IST.
So what do these three really tell a seller? Mostly, whether today looks like a trending day or a range day. That's useful context. A trending day argues for wider strikes, a smaller position, or skipping the trade. It doesn't argue for a directional bet, and it's not the first thing a seller should read.
Volatility tools a seller reads first: IV, IV percentile and India VIX
If you sell options, volatility is your price tag. It tells you whether the premium on offer is generous or thin compared with the risk you're taking. Three readings do most of the work.
Implied volatility (IV)
IV is the volatility figure that, plugged into an option pricing model, gives you the option's current market price. It's the market's estimate of how much the underlying will move, expressed as an annualised percentage. A NIFTY ATM option with an IV of 13% implies a smaller expected move than the same option at 20%. We go through the mechanics in more depth in our guide to implied volatility explained.
Here's a rough rule of thumb that turns IV into points. Divide the annual IV by the square root of 365 days to get a one-day figure. At 16% IV, that's about 16 ÷ 19.1, or roughly 0.84% per day. With NIFTY at 24,000, that's around 200 points for one standard deviation over one day. Use it as a sanity check, not a forecast. Real moves have fat tails, and the market prices that in.
IV percentile and IV rank
A raw IV number means little on its own. Is 15% high? It depends on where IV has been. IV percentile answers that: it's the share of days over the past year when IV was lower than today. An IV percentile of 80 means IV was lower on 80% of days in the last 252 trading sessions. IV rank does something similar using only the year's high and low, so one spike can distort it.
For a seller, a high IV percentile means premiums are rich by recent standards. That doesn't make it a good time to sell. IV is often high because something real is happening, like a budget, an election result or an RBI policy day. It just means you're being paid more for the same distance.
India VIX
India VIX is a volatility index built from NIFTY option prices across near and next-month strikes. The exchange publishes the calculation in its India VIX methodology page. It's derived from the same approach the CBOE uses for its own VIX. A reading of 12 suggests the market expects an annualised move of about 12% over the next 30 days. A reading of 20 means it expects a lot more.
Is India VIX an indicator? It's better thought of as a market-wide summary of option prices. It doesn't predict direction. It tells you the general price level of NIFTY options right now. When we compare a short strangle's premium across different VIX levels, the same strike distance can pay very different amounts. We worked through that link in our piece on India VIX and the short strangle premium budget.
Distance tools: ATR and the ATM straddle price
Once you know how expensive options are, the next question is how far away your strikes should be. Two tools answer that from different angles: one looks backward at what price actually did, the other looks forward at what the market is charging.
Average True Range (ATR)
ATR is another Wilder tool from the same 1978 book. It averages the "true range" of each bar, the largest of high minus low, high minus previous close, and previous close minus low. The Wikipedia article on Average True Range has the formula. A 14-day ATR on NIFTY of 220 points means the index has typically covered about 220 points from extreme to extreme each day over the last 14 sessions.
For a seller, ATR is a reality check on strike distance. Say NIFTY is at 24,000 and the 14-day ATR is 220. Selling a 24,100 call on expiry morning puts your strike less than half a day's normal range away. Selling 24,300 puts it more than one full ATR away. Neither choice is right or wrong in itself, but ATR tells you which one you're making.
The ATM straddle price
The ATM straddle is the at-the-money call plus the at-the-money put. Its combined premium is the market's own estimate of the move to expiry, in points. If the NIFTY 24,000 call trades at 95 and the 24,000 put at 105, the straddle is 200 points. Roughly speaking, the market is pricing an expected move of about 200 points either way by expiry.
That makes the straddle price one of the most practical numbers a seller can watch. It's already in points, it's already adjusted for time left, and it updates every tick. Many desks place short strikes as a multiple of the straddle: 1.0x, 1.25x or 1.5x away from spot. We explain how to read its intraday shape in our guide to reading a straddle chart.
ATR and the straddle often disagree, and that disagreement is the useful part. If ATR is 220 but the expiry-day straddle is only 150, the market is charging less than recent movement would justify. If the straddle is 300 and ATR is 180, premiums are rich. Neither situation is a trade by itself. It's a question to ask before you pick a strike.
Time: the indicator nobody plots
Time is the one input that every option price depends on and almost no chart shows. A buyer fights it. A seller is paid by it. Yet you'll rarely see "time to expiry" in a top-ten indicator list.
Option decay isn't linear. An ATM option loses value slowly when expiry is weeks away and very quickly in the last 1 to 2 days. The investor.gov glossary entry on options covers the basics of how an option's value includes time. On expiry day in Indian index options, a big share of an ATM option's remaining time value can disappear between 09:15 and 15:30 IST.
That has a practical effect on every other indicator here. A 200-point straddle at 09:20 on expiry day and a 200-point straddle with 4 days left describe very different risks. The first says the market expects the move to happen in about 6 hours. The second spreads it over roughly 4 sessions. When our team builds rules, time to expiry is always an explicit input, measured in minutes on expiry day and in days otherwise.
Time also changes how much a direction signal is worth. A Supertrend flip at 10:00 IST on expiry day matters a lot, because a 150-point move with 5 hours left can blow through a short strike. The same flip at 15:10 IST matters far less, because there isn't much time left for price to travel. Treat time as a dial that scales the weight of everything else.
How a rule-based system combines them without overfitting
The temptation, once you have a list like this, is to stack everything. RSI between 40 and 60, MACD flat, Supertrend not flipped in the last 30 minutes, India VIX between 11 and 16, IV percentile above 50, straddle above 1.1x ATR, entry after 09:45. Run that through a backtest and you'll almost certainly find a combination that looks spectacular over the past 2 years. It will usually fall apart in the next 6 months.
That's overfitting: tuning so many dials that the rules describe past noise instead of a lasting pattern. Here's how we keep it in check when we build rules on our own backtest engine.
First, each indicator gets one job. Volatility readings decide whether to trade at all and how big. Distance readings decide strike placement. Time decides entry and exit windows. Direction readings act as a filter that can veto a trade or widen a strike, never as the reason to enter. If two indicators do the same job, keep the simpler one.
Second, keep the parameter count low. Every threshold you add is another chance to fit noise. A rule with 3 inputs and round-number thresholds is easier to trust than one with 9 inputs set to 13.7 and 0.82.
Third, test out of sample. Our methodology is to tune on one block of history and judge the rule on a later block it has never seen. When we found that a rule only worked in the tuning period, we dropped it, however good it looked. We also run every candidate with realistic slippage and full trading costs, because a thin-edge selling rule can turn negative once costs are counted. For costs and contract specs, use the exchange circular or your broker's page in force at the time, never a number you remember from last year.
Fourth, read regime separately. A rule that sells premium when India VIX is 11 behaves very differently when VIX is 22. Rather than one rule for every condition, it's often cleaner to have a simple rule plus a clear "don't trade" zone.
Paper trade this first. Any rule that names a threshold, strike distance or time window should run on paper, or in a backtest with realistic costs, before a single rupee of live capital goes behind it. That applies to every example in this article.
If you'd rather see how complete, tested rules are put together, our page on algo trading strategies lays out the strategy families EliteAlgo works with. It's research and analytical software, not investment advice.
A side-by-side view: buyer vs seller
Here's the whole list split the way it should be. Notice that most of the "famous" indicators land in the buyer column.

| Question | Option buyer leans on | Option seller leans on |
|---|---|---|
| Is there a trade? | RSI, MACD, Supertrend signals | IV percentile, India VIX level |
| Which strike? | Delta, expected target | ATR, ATM straddle multiple |
| When to enter? | Breakout or crossover | Time to expiry, time of day |
| When to exit? | Target or trend flip | Stop on premium, time cut-off |
| Main enemy | Time decay | A fast, large move |
A short note on how this was put together. Our team reads the same top-ranking pages a trader would see, compares what they cover with what a seller needs, and fills the gap with the measures EliteAlgo actually uses in its own research. Indicator definitions follow their original published formulas. Point figures are illustrative.
Frequently Asked Questions
Which indicator is best for option trading?
None works best for everyone. Buyers need direction and timing, so RSI, MACD and Supertrend are common choices. Sellers need to price volatility and distance, so IV percentile, India VIX, ATR and the ATM straddle matter more. Pick the tool that answers your actual question.
Is RSI useful for option selling?
As a filter, yes. A very high or very low RSI shows the market is moving one way with force, which is a reason to widen the strike on that side or skip the trade. It isn't a reliable signal to sell options on its own.
What indicator do option sellers use?
Most sellers start with volatility: implied volatility, IV percentile and India VIX. Then they use ATR or the ATM straddle price to judge strike distance, and time to expiry to pick entry and exit windows. Direction tools come last, as a veto.
Is India VIX an indicator?
It's a volatility index calculated from NIFTY option prices. It shows how expensive options are and how big a move the market expects over the next 30 days. It doesn't predict direction.
How many indicators should a strategy use?
As few as possible, with each one doing a separate job. Two to four inputs is usually plenty. More inputs make it easier to fit past data and harder to trust the rule going forward.
Can indicators predict expiry-day moves?
No. The straddle price and India VIX tell you the size of move the market is pricing. They don't tell you which way it will go or whether it will happen. Indicators help you size and place risk. They don't remove it.