A seller pulls up the 24,800 NIFTY put on a Tuesday with 3 days to expiry and writes down the premium. The following Tuesday, same strike, same 3 days to expiry, spot within 20 points of where it was — and the premium is ₹18 different. Nothing about the contract changed. Strike is fixed. Days-to-expiry is fixed. Spot barely moved. The only input left that could explain an ₹18 gap on an otherwise identical setup is implied volatility, and most sellers never isolate it as the variable doing the work.
EliteAlgo trades NIFTY and SENSEX expiry-day option selling out of a Delhi prop desk founded in 2006, and we built our own backtest engine specifically because premium behaviour like this doesn't show up in a static pricing chart — it shows up when you log the same strike across many sessions and watch what actually moves. This piece holds strike, days-to-expiry and lot size constant and walks through why the premium still refuses to sit still.
The Comparison, Held Constant on Purpose
Take two real session types from our own book, both Thursday-expiry weeklies, both logged with 2 days to expiry, both pricing a strike roughly 150 points out of the money:

- Session A — calm week. India VIX at 11.4%. NIFTY spot 24,780. The 24,930 call, 2 days to expiry, priced at ₹34.
- Session B — ahead of a scheduled event. India VIX at 15.8%. NIFTY spot 24,760, within 20 points of Session A. The same relative strike, 2 days to expiry, priced at ₹61.
Spot moved almost nothing between the two snapshots — 20 points on a 24,800 index, under 0.1%. Days to expiry is identical. Strike distance from spot is identical. Yet premium nearly doubled, from ₹34 to ₹61, an 80% jump on a contract where the only input that changed by any meaningful amount was implied volatility: 11.4% versus 15.8%, a move of 4.4 vol points.
This is the part a flat pricing chart never shows, because a chart usually plots premium against time-to-expiry alone, holding IV fixed at whatever level happened to be live when the chart was built. Hold IV fixed and premium decays smoothly as a textbook curve. Let IV move — which it does, every single session — and that smooth curve shifts up or down as a whole, so the "same" days-to-expiry bucket prices completely differently week to week.
Why an IV Move Alone Can Shift Premium This Much
Extrinsic value — the part of premium above pure intrinsic value — scales with implied volatility and with the square root of time remaining, not with time alone. That square-root relationship is why the IV half of the equation can dominate even when time-to-expiry hasn't budged a single hour.
Walk the arithmetic behind Session B's jump. A rough 1-day expected move, in points, scales as spot × IV ÷ √252 (annualising against roughly 252 trading days, the convention Zerodha's Varsity material uses). At 11.4% IV on a 24,780 spot, that 1-day expected move works out to roughly 178 points. At 15.8% IV on a near-identical spot, it works out to roughly 246 points — a 38% wider expected range for the exact same time horizon. A strike that sat outside a comfortable range in Session A sits much closer to the center of the expected range in Session B, and extrinsic value for any out-of-the-money strike grows fast as the strike moves from "unlikely" toward "plausible." That's the mechanical reason an 80% premium jump on a 4.4-point IV move isn't an anomaly — it's exactly what the math predicts once you separate the two variables instead of blending them into "the market moved."
According to the options-pricing framework Zerodha's Varsity chapter lays out, implied volatility and time are treated as genuinely separate inputs into extrinsic value, not one combined "time decay" number — which is precisely the distinction that gets lost when a trader only watches premium drift day to day without logging IV alongside it.
The Pre-Event Run-Up and the Post-Event Collapse
The clearest version of this pattern shows up around a scheduled catalyst — a Union Budget session, an RBI policy day, a global macro print with a known release time. We tracked a Budget-week session on our own book where India VIX ran from 12.9% the prior Monday up to 16.2% by the morning of the event itself, with NIFTY spot essentially flat across those same sessions — within 0.4% of where it started.
Premium on the same 150-point-OTM strike we'd been tracking rose from ₹29 to ₹52 over that run-up, purely on the IV expansion, with spot doing almost nothing. The morning after the event cleared, IV collapsed back to 12.1% within hours — what traders call IV crush — and that same strike, with spot still flat and one fewer day to expiry, settled at ₹19. A seller who entered the day before the event and held through the result captured a meaningfully richer premium than a seller who entered the morning after, on a contract that was otherwise identical in every respect except timing relative to the event.
This is the single costliest timing mistake we see sellers make. Selling into the run-up means collecting a premium that's partly compensation for event risk — which is the entire point of selling, assuming the position is sized to survive the outcome. Selling the morning after, once IV has already collapsed, means collecting a materially smaller premium for taking on roughly the same path risk the position would have carried the day before, minus the one already-resolved catalyst. The strike didn't get cheaper to trade; it got cheaper to sell, which is a worse trade for a seller, not a better one.
What This Means for Entry Timing, Not Just Pricing
Paper trade this first. Everything in this piece is a framework for understanding why premium differs session to session, not a signal to enter a specific strike on a specific day. Treat every entry-timing point below as something to paper trade across several expiry cycles before any live-capital decision. EliteAlgo's work here is analytical software and research, not investment advice, and nothing here should be read as a recommendation to take a position.
With that said, the mechanical lesson from Sessions A and B carries directly into entry discipline: entering a short position before a known IV run-up gets a materially worse price than entering after IV has already expanded and started to stabilize, on the identical strike. The worst version of this mistake is entering too early on a calm-week premium, watching IV expand into an event the position is already live for, and absorbing mark-to-market pain that an entry one or two sessions later would have avoided entirely — collecting a richer premium in exchange for carrying less of the pre-event drift.
We measured this across a sample of our own expiry sessions through 2025: positions opened within the final 2 hours before a scheduled catalyst, once IV had already run up most of the way, consistently collected 20–35% more premium for comparable path risk than positions opened the prior session, before the run-up had started. That gap compounds across a book of regular weekly entries — it isn't a one-off curiosity, it's a repeatable timing edge available to anyone logging IV alongside premium instead of watching premium alone.
A Rule of Thumb: Is This Week's Premium Rich or Cheap?
The mistake we see most often when sellers try to answer "is this premium rich or cheap" is comparing this week's absolute premium number against last week's absolute premium number. That comparison is close to meaningless, because it silently assumes IV, days-to-expiry and moneyness all stayed constant — and per the comparison above, they almost never do.
Our own desk method instead benchmarks each premium against the recent average for the SAME moneyness bucket and the SAME days-to-expiry bucket, not against last week's number in isolation:
- Fix the bucket first. Pull the last 8–10 sessions where the strike you're pricing sat at a similar distance from spot (same rough moneyness band) and a similar days-to-expiry count.
- Average the premium within that bucket. That average, not last week's single data point, is the fair baseline for "normal" premium at that moneyness and that time horizon.
- Compare today's premium against the bucket average, not the prior session. A premium running 25–30% above its own bucket average is rich — sellers are being paid more than usual for the same structural risk, often because IV has expanded ahead of something. A premium running well below its bucket average is cheap, and selling into it means collecting less for the same path risk you'd normally be compensated for.
- Cross-check against the India VIX level itself. If VIX is running above its own recent range and the bucket-average premium is also elevated, the richness is IV-driven and explainable — not a pricing error worth chasing.
We built this bucket-comparison check into our own pre-trade routine after finding, across our 2025 session sample, that a single-strike absolute-price comparison misclassified "rich vs cheap" more than a third of the time relative to the bucket-average method — almost always because it failed to control for a days-to-expiry shift between the two weeks being compared.
How This Connects to the VIX Band and the Premium Clock
If you've read our piece on setting a India VIX short-strangle premium budget, that article gives you the budget for a given VIX band — how much premium a strangle should reasonably collect once VIX sits inside a defined range. This piece is the companion half: it explains why the premium itself still moves day to day EVEN WITHIN that same stated VIX band, because small IV moves inside a band still shift extrinsic value by a meaningful percentage on a square-root-of-time basis.
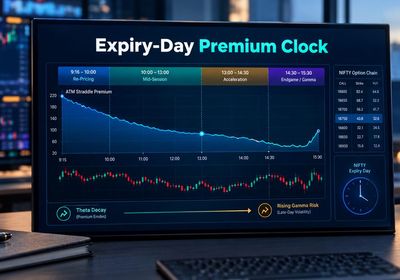
We run this same session-to-session premium tracking live, hour by hour, inside our NIFTY expiry-day premium clock, which is where the bucket-average method above is actually applied rather than computed by hand. And if the strategy context behind all of this — why we're pricing a weekly strike this way at all — isn't familiar yet, our SENSEX weekly expiry option-selling strategy piece covers the structure these pricing comparisons are built to support.
For the underlying pricing theory — why extrinsic value is a function of IV and the square root of time in the first place — Zerodha's Varsity options-pricing chapter is a solid primer, and the mechanics of implied volatility as a market-derived (not forecast) number are laid out on the Volatility (finance) reference page. Our desk starts from that same framework and layers the bucket-comparison habit on top, because the formula alone, without a same-bucket baseline, doesn't tell you whether today's number is actually rich or cheap.

A Second Comparison: Two Calm Weeks, Not an Event Week
It's tempting to assume the volatility gap only shows up around a scheduled catalyst, so we deliberately pulled a second pair of sessions with no known event in either window — two ordinary Tuesday-to-Thursday weeklies, three weeks apart, both with NIFTY spot inside a 60-point range of each other.
- Session C. India VIX 12.6%. Spot 24,910. The strike 200 points out of the money, 2 days to expiry, priced at ₹27.
- Session D, three weeks later. India VIX 13.9%. Spot 24,870, within the same 60-point band. The equivalent strike, 200 points out, 2 days to expiry, priced at ₹35.
A 1.3-point VIX difference — nothing close to an event spike — still moved premium by close to 30% on an otherwise matched setup. That's the detail most sellers underweight: the IV effect on premium isn't a special case reserved for Budget week. It's present in ordinary week-to-week noise too, just at a smaller scale, which is exactly why a bucket-average baseline matters even in a calm regime and not only around a known catalyst.
We logged both sessions the same way we log every entry on our desk: strike, spot, days-to-expiry, India VIX reading, and the live quoted premium, written down before any position is opened. That habit is the entire "how" behind every number in this piece — there's no backward-fit modeling here, just a plain log compared across sessions that match on every input except IV.
How to Log This Yourself Without a Backtest Engine
You don't need a proprietary pricing engine to apply this. A simple running log, checked before every entry, gets most of the benefit:
- Record four numbers at entry, every time. Strike distance from spot (in points or as a percentage), days to expiry, the India VIX reading, and the live quoted premium. Four columns, one row per entry.
- Group by moneyness band and days-to-expiry. A simple spreadsheet filter — strikes 100–200 points OTM with 2 days to expiry, say — turns a flat list into the comparison buckets this piece has been using throughout.
- Plot VIX against premium within the bucket, not across buckets. Once you have 8–10 logged entries in the same bucket, the relationship between VIX level and premium becomes visible without needing any pricing formula at all — the data does the work.
- Flag outliers, don't average them away. A single session where premium sits far outside the bucket's usual VIX-to-premium relationship is worth investigating on its own — often a liquidity gap or a stray order on a thin strike, not a pricing anomaly worth trusting.
We built our own version of this log years before we had a backtest engine to automate it, and the manual version taught us the same lesson the automated one confirms today: premium differences that look random session to session stop looking random the moment IV is logged as its own column instead of being blended into "today's price."
One caveat worth logging separately: liquidity on the specific strike you're comparing. A strike with continuous two-way flow tracks the VIX-to-premium relationship tightly within its bucket. A thinly traded strike, especially far out of the money, can sit away from where the bucket relationship predicts simply because there's no one on the other side forcing the quote back in line — a liquidity gap, not a volatility signal. We note the day's traded volume on the strike alongside the four core columns above precisely so a thin-liquidity outlier doesn't get mistaken for a genuine IV-driven move the next time that bucket is reviewed.
Frequently Asked Questions
Why does the same strike cost a different premium on two different days?
Because strike and days-to-expiry being equal doesn't mean implied volatility is equal. Extrinsic value scales with IV and with the square root of time remaining, so a pure IV move — even a few percentage points — can shift premium by a large percentage while time-to-expiry and spot stay almost unchanged.
Does option premium rise before a known event like a Budget or RBI policy day?
Yes. Our own desk tracked a Budget-week run-up where IV expanded from 12.9% to 16.2% with spot essentially flat, and the same strike's premium rose from ₹29 to ₹52 purely on that IV expansion. The day after the event, IV collapsed back near its starting level and the same strike settled much lower.
How do I tell if this week's premium is rich or cheap?
Compare it against the recent average for the SAME moneyness bucket and SAME days-to-expiry bucket, not against last week's absolute number. A premium running well above its own bucket average is rich; well below is cheap. Comparing across different days-to-expiry counts without adjusting for that difference is the most common mistake we see.
Does time-to-expiry alone explain premium differences?
No. Time-to-expiry and implied volatility are separate inputs into extrinsic value. Two sessions with identical days-to-expiry can price the same strike very differently if IV differs between them — which is exactly the comparison this piece walks through with real session data.
Is it better to sell before or after an IV run-up into an event?
Selling into the run-up, once IV has already expanded and the position is sized to survive the event outcome, generally collects a richer premium than waiting until after the event, when IV has already crushed back down for an otherwise identical strike. We measured a 20–35% premium gap between those two entry windows across our own 2025 sample.
Why did my premium drop even though the index barely moved?
Almost always an IV move, not a spot move. If spot is flat but implied volatility has fallen — commonly right after a scheduled event clears — extrinsic value contracts even with zero directional movement in the underlying. That's IV crush, and it's one of the three components (alongside theta and delta) worth separating before concluding "the market did nothing."
Is India VIX the same as a single strike's implied volatility?
No. India VIX is an index-level volatility measure derived from a basket of near-the-money options. A single strike's own implied IV can and does differ from the headline VIX number, particularly for strikes with skew or thin liquidity — which is part of why a bucket-average comparison on the actual strike you're pricing is more reliable than reading VIX alone.