
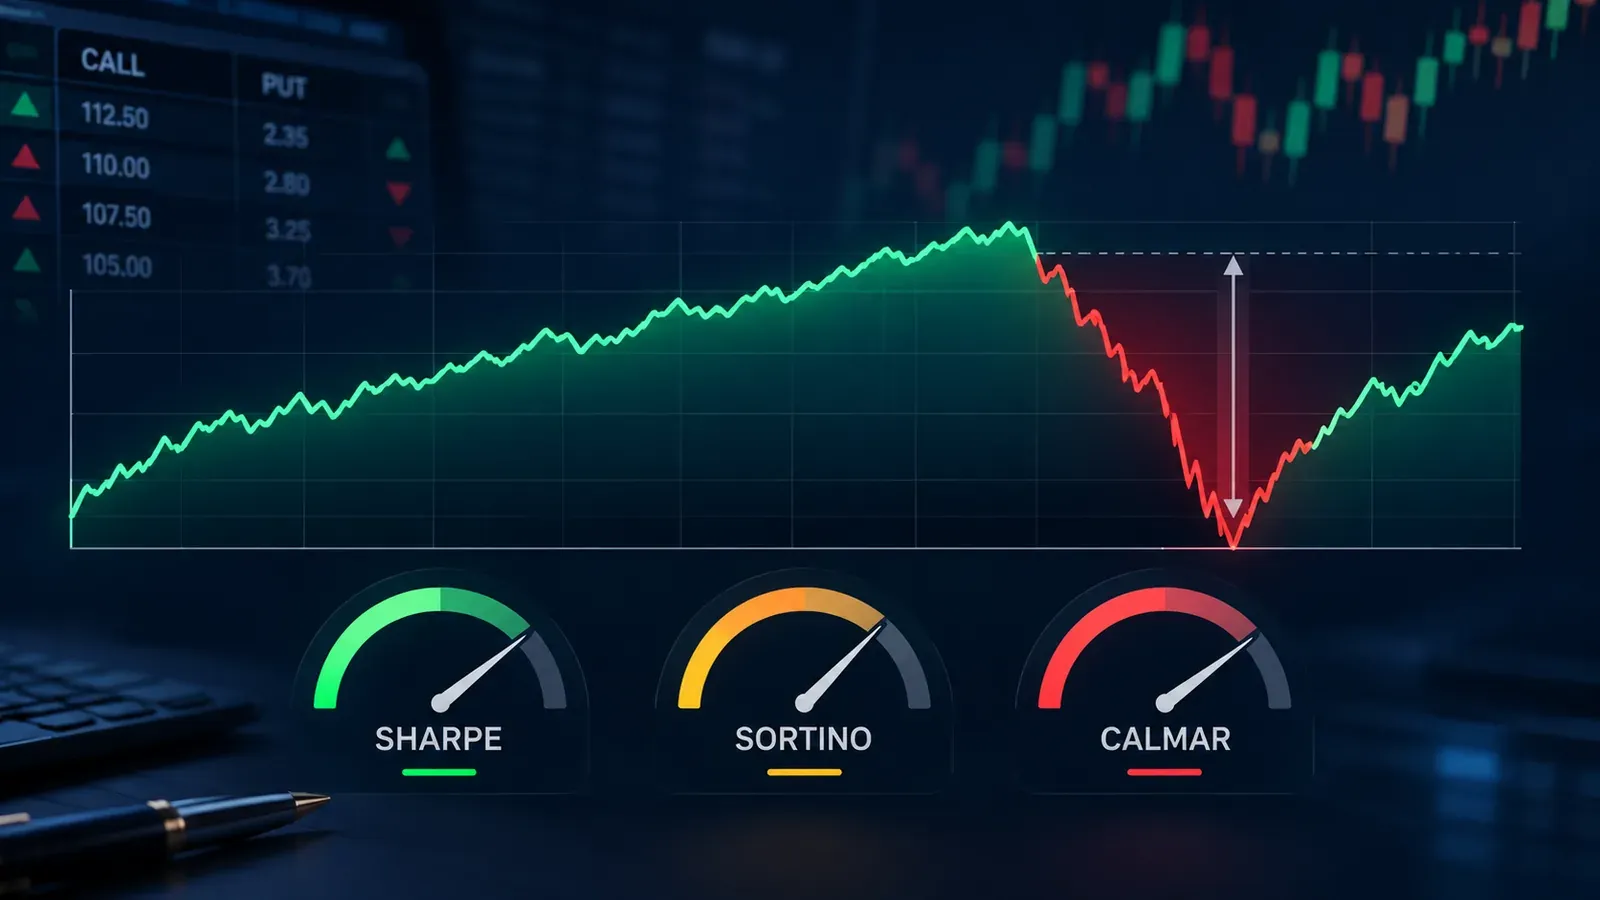
Most pages on the Sharpe ratio were written for mutual fund investors. They explain the formula, say "higher is better", and stop. That is fine for a diversified equity fund. It's a trap for an option seller.
Short premium makes money in a very particular shape: many small wins, a few ordinary losses, and every so often one week that undoes months of work. The Sharpe ratio was not built for that shape. It can print an excellent number for a strategy that is quietly carrying a large hidden loss, right up to the week the loss arrives. Sortino and Calmar look at the same returns from different angles, and on short-premium books they often disagree with Sharpe in ways that matter.
Here's the short answer. For a NIFTY or SENSEX option-selling backtest, read the Calmar ratio and the maximum drawdown first, Sortino second, and Sharpe last. Use Sharpe to compare like with like, never as proof that a short-premium strategy is safe.

EliteAlgo is a Delhi proprietary desk that has traded since 2006. Our team sells index options on expiry days and through the weekly cycle, and every rule is run on our own backtest engine before it touches capital. When we review a backtest, the drawdown table is open before anyone looks at a ratio. This article shows why, using one illustrative return series that is clearly made up for teaching. It is not desk data and it is not a strategy.
Paper trade this first. Any number, threshold or rule in this article describes how a ratio behaves, not a trade instruction. Run any strategy on paper across several expiries before it influences live capital. This is EliteAlgo's analytical research, not investment advice.
The three ratios in one line each
All three ratios ask the same question: how much return did you get for the risk you took? They differ only in what they count as risk.
- Sharpe ratio = (average return minus the risk-free rate) divided by the standard deviation of returns. Risk is every wiggle, up or down.
- Sortino ratio = (average return minus a target return) divided by the downside deviation. Risk is only the returns that fall below the target.
- Calmar ratio = annualised return divided by the maximum drawdown. Risk is the single worst peak-to-trough fall in the equity curve.
William Sharpe first proposed his measure in 1966 as the "reward-to-variability" ratio. His own 1994 paper, "The Sharpe Ratio" in the Journal of Portfolio Management, is still hosted on his Stanford page and is worth reading in full. One point from it gets lost in most retail explainers: Sharpe describes the ratio as a tool for choosing between alternatives measured in the same way over the same period. It was never meant to be an absolute safety score.
The Sortino ratio is named after Frank Sortino. According to the Wikipedia entry on the Sortino ratio, it was developed as a variant of Sharpe that penalises only harmful volatility. The Calmar ratio comes from the managed-futures world. Per the Wikipedia entry on the Calmar ratio, Terry W. Young introduced it in 1991, and the name is short for California Managed Accounts Reports, his newsletter. The standard version uses the last 36 months of data.
That's the textbook. The rest of this piece is about what happens when you feed these formulas the returns of a short-premium book.
Why short-premium returns break the Sharpe ratio's assumptions
Standard deviation is a fair measure of risk when returns are roughly symmetric and roughly bell-shaped. The ups and downs are about the same size, extreme days are rare on both sides, and one number can describe the spread. Short-premium returns are none of those things.
When you sell an at-the-money straddle or an out-of-the-money strangle on an expiry morning, the most you can make is the premium you collect. The most you can lose is many times that. On a quiet day, time decay does its work and the trade closes green. On a day when the index travels 1.5% or 2% in one direction, the losing leg can cost more than a month of normal gains. That's the deal. You are paid a small, steady amount to carry the risk of a rare large move.
The statistical name for this shape is negative skew with fat tails. In plain English: most days look the same, and the bad days look nothing like the rest. Three things follow for the Sharpe ratio.
First, standard deviation punishes upside. A strategy that has a big winning day is treated as "riskier" by Sharpe, exactly as if it had a big losing day. A long-option or trend strategy, which wins rarely but large, is marked down for its best days.
Second, a short-premium book looks calm until it isn't. Over any window that happens to miss the large loss, the daily spread is small and the average is positive, so Sharpe comes out very high. A backtest over one benign year can show a Sharpe of 4 or 5. That number says almost nothing about the week the market gaps.
Third, the ratio has no memory of order. Sharpe uses the average and the spread, and shuffling the days changes neither. Five losing days in a row and five losing days scattered across a year produce the same Sharpe ratio. Your capital, and your nerves, feel those two cases very differently. Drawdown sees the order. Sharpe doesn't.
None of this makes Sharpe useless. It means Sharpe answers a narrower question than most people think. It tells you how smooth a return stream has been on average. It doesn't tell you how deep the hole can get.
Sortino: only the downside counts
Sortino fixes the first problem directly. Instead of dividing by the standard deviation of all returns, it divides by the downside deviation: the spread of only the returns below a target. Winning days stop counting as risk.
The usual recipe for daily data looks like this:
- Pick a target return. For an intraday book, 0 is the common choice: any losing day counts as downside.
- For each day, take the shortfall below the target. A day that made money has a shortfall of 0. A day that lost ₹4,000 on ₹10 lakh capital has a shortfall of -0.4%.
- Square the shortfalls, average them across all days (not just the losing days), and take the square root. That's the daily downside deviation.
- Divide the average daily return, minus the target, by the downside deviation. Multiply by the square root of 250 to annualise.
One detail trips people up. Step 3 divides by the total number of days, including the green ones. Some spreadsheets divide only by the number of losing days, which inflates the downside deviation and shrinks the ratio. Neither version is wrong, but two Sortino numbers built different ways can't be compared. Check which one your software uses before you put two strategies side by side.
For an option seller, Sortino is more honest than Sharpe in one respect and still blind in another. It stops penalising the occasional large winning day, which helps long-volatility and trend strategies get a fair hearing. But it still uses an average of squared losses. A single ₹38,000 day is averaged in with fifty ₹2,000 days, and the result is softened. Sortino sees the tail more clearly than Sharpe, yet it still doesn't tell you the size of the hole.
Calmar: return against the worst drawdown
Calmar does something the other two don't. It throws away the day-by-day distribution and looks at the equity curve. Find the highest point the account reached, find the lowest point it fell to before making a new high, and measure the gap. That's the maximum drawdown. Divide the annualised return by it.
A Calmar of 2 means the strategy earned, per year, twice its worst peak-to-trough fall. A Calmar of 0.5 means one bad stretch wiped out two years of return.
For a short-premium book this is the number closest to what actually hurts. Drawdown is the figure that sets position size, decides whether you can stay in the game after a bad month, and determines how much spare margin you need. It also captures order: five losing days in a row produce a deeper drawdown than five scattered ones, and Calmar sees that.
It has weaknesses too. It rests on one event, so it's noisy: a backtest that happens to start just after a crash will show a flattering drawdown. It gets worse the longer the test runs, because longer tests have more chances to hit a bad stretch, which is why the 36-month convention exists. And it says nothing about how often drawdowns happen, only how deep the worst one was. Read it with the full drawdown table, not alone.
Same illustrative series, three different verdicts
Numbers make this clearer than words. What follows is a made-up example, built only to show how the ratios react. It is not EliteAlgo desk data, it is not a backtest of any real strategy, and the figures should not be read as typical returns for anything.
Test setup for the example
The methodology is simple. Two imaginary strategies each trade 250 days, roughly one market year, on ₹10,00,000 of capital. P&L is in rupees per day with no compounding. Both series were generated with a fixed random seed so the numbers can be reproduced:
- Strategy A (short-premium shape): on about 78% of days a small gain between ₹800 and ₹3,200; on the rest a loss between ₹1,500 and ₹6,500. The last five days are a bad week: -₹21,000, -₹38,000, -₹8,000, +₹5,000 and -₹11,000.
- Strategy B (long-premium or trend shape): on about 56% of days a loss between ₹1,000 and ₹4,000; on about 33% a small gain; and on roughly 11% a large win between ₹8,000 and ₹18,000.
Ratios use daily returns with a 0% target and a 0% risk-free rate, annualised with the square root of 250. Calmar uses the one-year return over the one-year maximum drawdown. That's shorter than the 36-month convention, so treat the Calmar figures as a teaching aid.
Before the bad week
Look at Strategy A after its first 245 days, with the bad week still in the future. It made ₹1,92,900, about 19.7% annualised. It won on 79.6% of days. Its worst day was -₹6,400, and its deepest drawdown was ₹11,700, just 1.2% of capital.
The ratios are spectacular. Sharpe is 4.77. Sortino is 6.43. Calmar is 16.82. Anyone handed this backtest would be tempted. We've seen backtest summaries in this range shared in trading groups as if they settled the matter.
After the bad week
Now add the five days. The account gives back ₹73,000 in a week, close to five months of normal gains. Here is the full-year picture next to Strategy B:
| Measure (illustrative) | A, first 245 days | A, full 250 days | B, full 250 days |
|---|---|---|---|
| Total P&L | ₹1,92,900 | ₹1,19,900 | ₹1,20,500 |
| Annualised return | 19.7% | 12.0% | 12.0% |
| Winning days | 79.6% | 78.4% | 41.6% |
| Worst day | -₹6,400 | -₹38,000 | -₹4,000 |
| Best day | ₹3,200 | ₹5,000 | ₹17,700 |
| Daily standard deviation | ₹2,611 | ₹3,934 | ₹5,091 |
| Max drawdown | ₹11,700 (1.2%) | ₹74,000 (7.4%) | ₹31,900 (3.2%) |
| Sharpe | 4.77 | 1.93 | 1.50 |
| Sortino | 6.43 | 2.19 | 3.68 |
| Calmar | 16.82 | 1.62 | 3.78 |
The two strategies end the year within ₹600 of each other, both at 12.0% annualised. That makes the comparison clean. Same return, different risk.
Sharpe picks Strategy A, 1.93 against 1.50. Strategy B's large winning days push its standard deviation up to ₹5,091, and Sharpe reads those wins as risk. A's spread is lower because most of its days are small and alike. The one week that cost ₹73,000 is averaged into 250 days and diluted.
Sortino picks Strategy B, 3.68 against 2.19. Once B's winning days stop counting against it, its many small losses (146 losing days, none worse than ₹4,000) look mild. A's losses are fewer, only 54 losing days, but four of them sit in one week and are large. Squared and averaged, they dominate A's downside deviation.
Calmar picks Strategy B by a wide margin, 3.78 against 1.62. B's worst stretch cost ₹31,900. A's cost ₹74,000, more than double, for the same yearly return.
Read the columns again and notice what the A, first 245 days column would have told you. Every ratio said "excellent". The bad week was not visible in the data because it hadn't happened yet. This is the core risk with short-premium backtests: a test window that misses a tail event will rate the strategy highly on every measure. No ratio can see a loss that isn't in the sample. The only defence is a longer, harder test window, which we cover in our guide on how to backtest an option-selling strategy, including the expiry days that should always be in the sample.
What the risk-free rate does to the example
Plug in a risk-free rate and the numbers move. As a placeholder only, take an annual 6.5%; for a real calculation use the current 91-day Treasury bill yield published by the Reserve Bank of India. Strategy A's Sharpe drops from 1.93 to 0.88, and Strategy B's from 1.50 to 0.69. The ranking doesn't change, but both now look ordinary, because a 12% strategy carrying a 7.4% drawdown is being compared with a near-riskless 6.5%. That's arguably the more honest way to see it. The FAQ below covers when to include it.
Which ratio to read first, and why
In our experience, the order you read a backtest report in shapes the conclusion you reach. Sharpe on the first line anchors everything that follows. For a short-premium book we'd read it in this order.
1. Maximum drawdown in rupees, and the dates. Before any ratio. Ask: could I have sat through this? Would my margin have survived it? Which days caused it, and were they expiry days, event days or gap openings? A drawdown that came from one budget day tells you something very different from a slow bleed across three months.
2. Calmar. It puts the drawdown against the return, so you can compare strategies of different size. On a short-premium book, a Calmar well below the strategy's Sharpe is a warning that the return stream is smoother than its tail risk deserves. In the example, Strategy A's Sharpe of 1.93 sits above its Calmar of 1.62, while B's Calmar of 3.78 is more than double its Sharpe of 1.50. That gap pattern is the skew showing through.
3. Sortino. It tells you whether the losses are frequent and small or rare and large, once winning days stop counting as risk. Compare it with Sharpe. If Sortino is barely higher than Sharpe, as with Strategy A's 2.19 against 1.93, the downside is doing most of the damage. If Sortino is far higher, as with B's 3.68 against 1.50, a lot of the volatility was upside.
4. Sharpe. Last, and only for comparing variants of the same strategy over the same window: two stop-loss levels on one straddle, say, or the same rules on NIFTY and SENSEX. Across very different strategy shapes, it misleads.
Then go past the ratios. Look at the worst five days and the worst five weeks. Count how many months were negative. Check how long the longest drawdown took to recover. A ratio squeezes a year into one number; these tables show what the year was actually like. We go deeper on the limits of any backtest summary in what a backtest can and can't prove.
Four habits that make the ratios more trustworthy
Use daily P&L, not per-trade P&L. Many retail backtesting tools report ratios computed per trade. If you trade twice on some days and not at all on others, per-trade figures don't annualise correctly. Build a daily series, with zeros on non-trading days, and compute from that. When we compared tools for our review of options backtesting software in India, the way each one calculated its headline ratios was one of the first things worth checking.
Include costs and slippage first. Brokerage, exchange charges, taxes and slippage all come off the small winning days of a short-premium book. A strategy with a thin edge can show a solid Sharpe gross of costs and a weak one net of them. Don't hard-code a tax or charge rate from an old blog post; use the rates your broker's contract note shows today.
Test across regimes. One low-volatility year can produce the 4.77 Sharpe in our example. Split the data by year, by VIX level, or by weekly versus monthly expiries, and calculate the ratios for each slice. A strategy that only scores well in one slice has not been tested; it has been fitted.
Treat a very high number as a question. A daily Sharpe above 3 on a short-premium strategy usually means the sample missed something: a short window, no event days, unrealistic fills, or a strategy that has not yet met its bad week. It isn't impossible. It's a reason to look harder before believing it.
A note on what "good" looks like
Readers ask for thresholds: is a Sharpe of 1.5 good? Is a Calmar of 2 enough? There's no honest single answer, because the number depends on the window, the frequency, the costs and the risk-free rate used. A rough reading for a daily, cost-included, multi-year backtest:

A Sharpe below 1 is weak for an intraday strategy. Between 1 and 2 is respectable. Above 3 should make you suspicious rather than excited. For Calmar over 36 months, below 0.5 means drawdowns are large relative to return; between 1 and 3 is workable; above that, check whether the test window included a real stress period. For Sortino, the useful reading is relative: how much higher than Sharpe is it?
Those are guides for reading research, not targets to trade towards. Our piece on whether algorithmic trading is profitable, using our own data shows how far a live record can sit from a backtest summary.
How the ratios fit into a full review
Ratios are a summary, and a summary is only as honest as the data under it. The full review of a short-premium strategy covers the equity curve, the drawdown table with dates, the worst days, the monthly breakdown, cost and slippage assumptions, and an out-of-sample period the rules were never tuned on. Data from a single backtest run is a starting point, not a verdict.
If you'd rather not build that pipeline yourself, EliteAlgo's managed algo trading service describes how we run and monitor rule-based option strategies. Either way, the principle holds: no single ratio should approve a strategy. For general background on how volatility is used to describe investment risk, the U.S. SEC's investor education site has a short glossary entry on volatility. For a worked walk-through of the basic Sharpe arithmetic, Schwab's guide to calculating the Sharpe ratio is clear and neutral.
Frequently Asked Questions
What is a good Sharpe ratio for an option-selling strategy?
There's no fixed cut-off. On a daily, cost-included, multi-year backtest, a Sharpe between 1 and 2 is respectable for an intraday strategy. Above 3 on a short-premium book usually means the test window missed a tail event or the fills were optimistic. Read Sharpe alongside maximum drawdown and Calmar, never alone.
What is the difference between Sharpe and Sortino?
Sharpe divides excess return by the standard deviation of all returns, so big winning days count as risk. Sortino divides by the downside deviation, which only counts returns below a target, usually 0 for intraday books. For strategies with rare large wins, Sortino is usually much higher than Sharpe. For short-premium books, the two are often close, because the losses drive most of the spread.
How is the Calmar ratio calculated?
Take the annualised return and divide it by the maximum drawdown, the largest fall from a peak in the equity curve to a later low before a new high. The standard version uses the last 36 months. A strategy that earned 12% a year with a worst drawdown of 6% has a Calmar of 2.
Can a strategy have a high Sharpe ratio and still blow up?
Yes. Short-premium strategies earn small, steady gains and carry rare, large losses. Over a window that happens to miss those losses, the daily spread is tiny and Sharpe comes out very high. In the illustrative example above, Strategy A showed a Sharpe of 4.77 before its bad week and 1.93 after it, with a drawdown six times larger.
Which ratio should I use to compare two backtests?
Start with maximum drawdown and Calmar, then Sortino, then Sharpe. Make sure both backtests use the same window, the same data frequency, the same costs and the same risk-free rate, or the comparison is meaningless. Sharpe is most useful for comparing small variations of one strategy, not strategies with very different return shapes.
Should the risk-free rate be included for intraday strategies?
For comparing two intraday strategies with each other, using 0 is common and doesn't change the ranking. For judging whether a strategy is worth running at all, include it. The capital backing an intraday book could otherwise earn the Treasury bill yield, and a strategy should be measured against that. Use the current 91-day T-bill yield rather than a fixed number from an old article.
The ratios are tools for asking better questions about a backtest, not a stamp of approval. If you're testing your own rules, start with the drawdown, find the bad weeks, and only then look at the summary numbers.